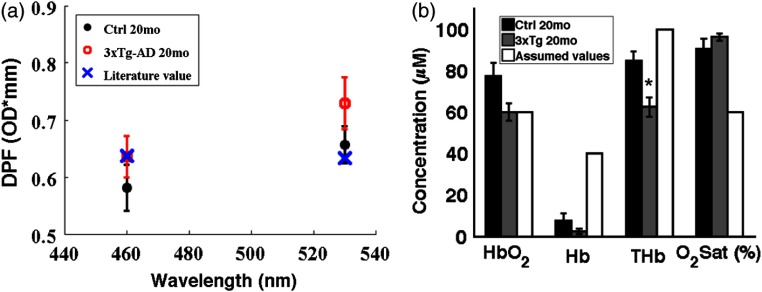
Fig. 3.
(a) The average and standard error of ROI values in each group are shown for differential pathlength factor (DPF) and compared to a literature-reported value.36 (b) The average and standard error of , Hb, THb, and sat in each group are shown and compared to typically literature-reported values.37,38

