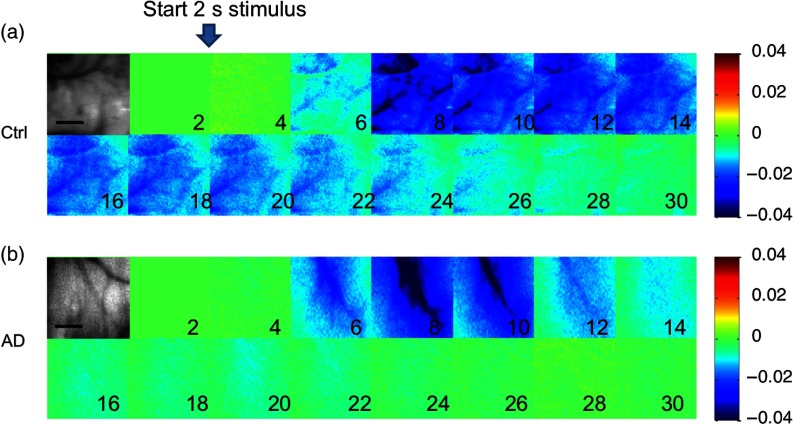
Fig. 4.
Representative montage of the normalized reflectance change at 530 nm in the ROI (grayscale image) for (a) controls and (b) 3xTg-AD mice. Stimulation started after 2 s of baseline, lasted for 2 s, and images every 2 s subsequently are shown up to 30 s. Color scale shows normalized changes from to 4%. Scale bars (grayscale images) are 1 mm.

