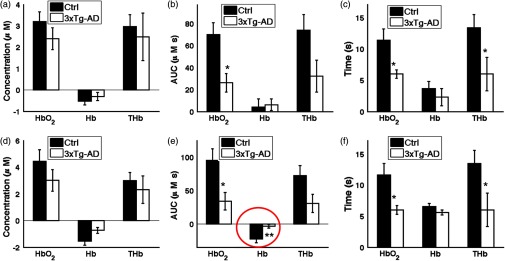
Fig. 6.
Three parameters are compared that describe the overperfusion response in the mice. Graphs in (a), (b), and (c) are calculated in the case where the MBLL was informed with assumed DPFs, based on optical property values commonly used by other groups. Graphs in (d), (e), and (f) are calculated in the case where the MBLL was informed with SFDI-derived DPFs. (a, d) Peak hemodynamic change was determined by finding the largest concentration change from baseline of , Hb, and THb after the 2-s stimulation. (b, e) Area-under-the-curve (AUC) of the overperfusion after the 2-s stimulation was calculated by integrating the average hemoglobin concentration changes from 4 to 30 s. (c, f) Relaxation time of the hemodynamic response was calculated as the time the overperfusion returns to half its peak value. * for both assumed DPF baseline and SFDI-derived DPF baseline for hemodynamic fitting. ** for SFDI-derived DPF baseline and not assumed DPF baseline.

