-
A, B
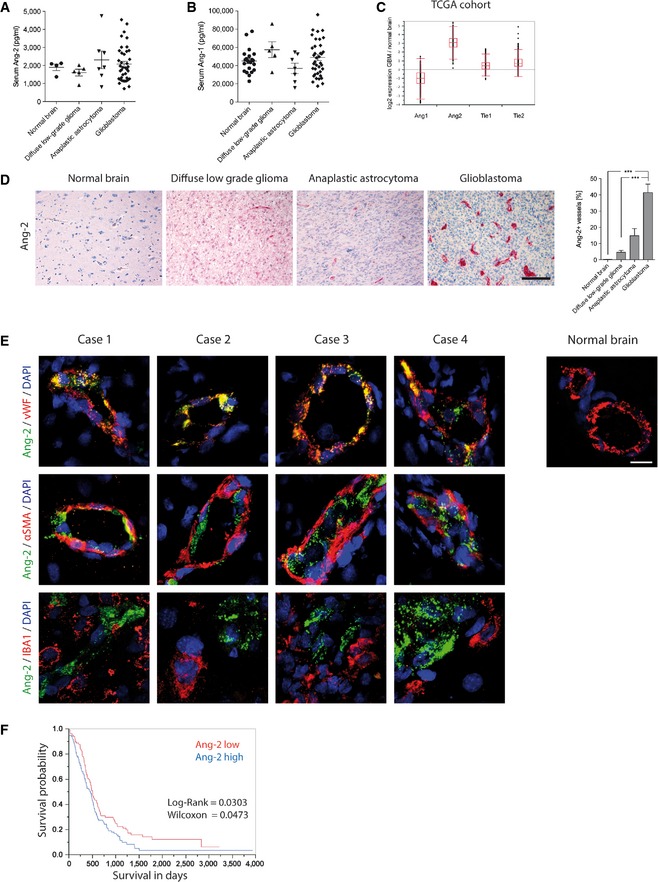
ELISA displaying human Ang‐2 (A) and Ang‐1 (B) level in serum of healthy volunteers (Ang‐2 n = 4; Ang‐1 n = 21) or patients with low‐grade diffuse glioma (WHO II) (n = 5), anaplastic astrocytoma (WHO III) (n = 7), or glioblastoma (WHO IV) (n = 39) are shown.
-
C
The TCGA database was accessed to obtain gene expression level for Ang‐1, Ang‐2, Tie2, and Tie1 in GBM in comparison with normal brain (box‐and whisker plot showing median, 25–75th percentile, upper and lower quartile including outliers).
-
D
Ang‐2 expression and quantitative analysis of Ang‐2 in healthy human brain (n = 3), low‐grade diffuse glioma (n = 14), anaplastic astrocytoma (n = 12), or glioblastoma (n = 11) are shown. Scale bar: 100 μm.
-
E
Co‐staining of Ang‐2 and vWF (endothelial cells), αSMA (mural cells), and IBA1 (microglia) in different glioblastoma specimen. Normal brain tissue was used to assess Ang‐2 staining specificity. Scale bar: 20 μm.
-
F
Ang‐2 predicts survival of glioblastoma patients.
Data information: If not indicated differently, Kruskal–Wallis test (Dunn's post‐test) was applied, ***
data are mean ± SEM.
.

