
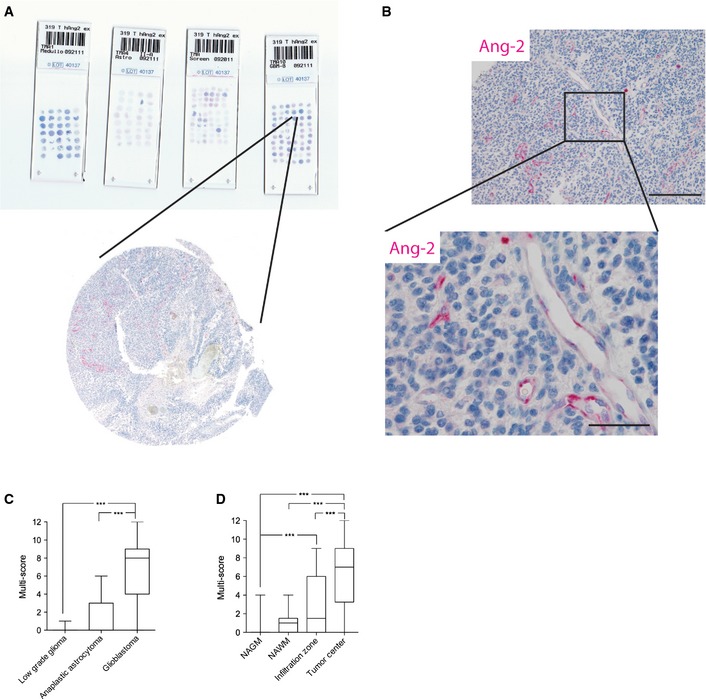
Figure EV1. Application of tissue microarrays (TMAs) for the analysis of human glioma samples.
-
A, BBiopsies of 303 human gliomas (WHO grade II , n = 16, WHO grade III, n = 35, and WHO grade IV, n = 252) were spotted on microscope slides (A) and processed for automated anti‐Ang‐2 immunohistochemistry (Ventana Benchmark platform) (B). Scale bar (B): 200 μm, inset: 50 μm.
-
CAng‐2 expression was assessed by applying a semiquantitative scoring system (Harter et al, 2010).
-
DSpatial expression of Ang‐2 in brain specimens from glioblastoma patients was scored in normal‐appearing gray matter (NAGM) (n = 48), normal‐appearing white matter (NAWM) (n = 18), infiltration zone (n = 39), and tumor center (n = 62).
Data information: In (C, D), for statistical analysis, Kruskal–Wallis test (followed by Dunn's post‐test) was applied. ***P < 0.005. Whisker Box plots displaying median, 25–75th percentile, upper and lower quartile.