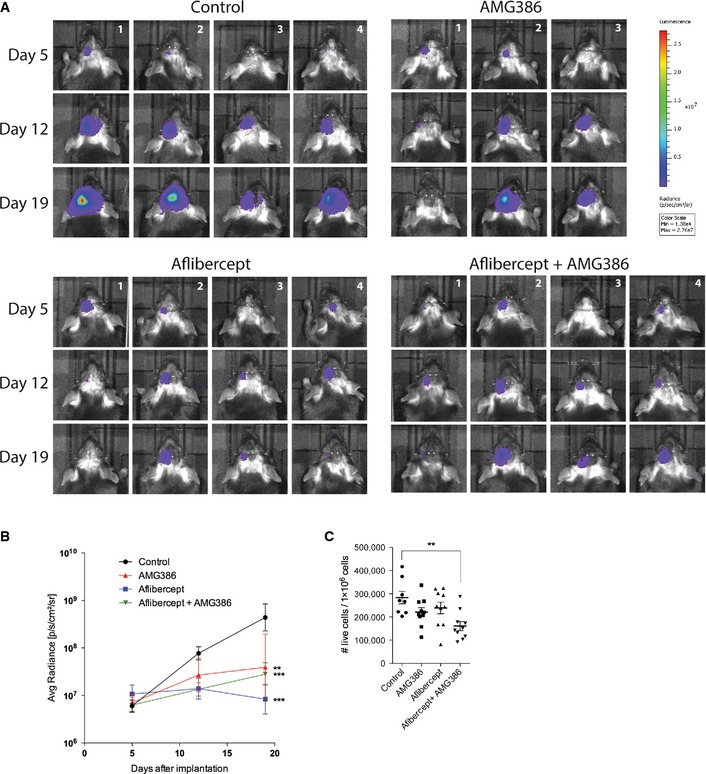
Figure EV3. Noninvasive imaging of GL261 tumor growth following anti‐angiogenic therapy.

-
A, BBioluminescence imaging of GL261‐luc glioma cells on day 5, 12, and 19 after surgical implantation following AMG386, aflibercept, and combination treatment (A), and corresponding quantitative analysis (B). (Control n = 4; AMG386 n = 4; aflibercept n = 3; AMG386 + aflibercept n = 4.)
-
CFlow cytometric analysis of DAPI‐negative live cells in mouse Gl261 brain tumors following anti‐angiogenic therapy (control n = 4; AMG386 n = 4; aflibercept n = 5; AMG386 + aflibercept n = 5).
Data information: One‐way (C) and two‐way (B) ANOVA followed by Tukey post‐test were performed for statistical analysis, **P < 0.01, ***P < 0.005. Data are mean ± SEM (B), mean ± SD (C).
