
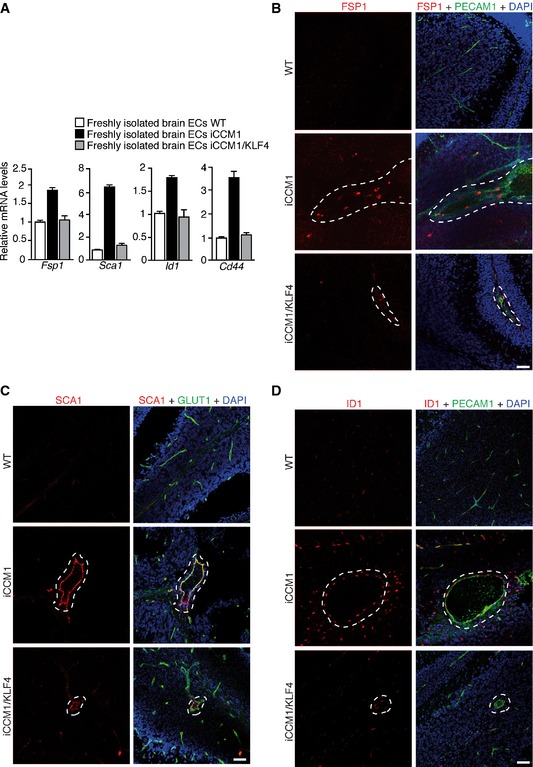
Figure EV5. EndMT marker expression is reduced in the absence of KLF4 ex vivo and in vivo .
-
AqRT–PCR of some EndMT markers in freshly isolated brain ECs from WT, iCCM1, and iCCM1/KLF4 mice analyzed at P12. Fold changes are relative to WT animals. Data are mean ± SD from a representative experiment out of three.
-
B–DRepresentative confocal analysis of (B) PECAM1 (green) and FSP1 (red), (C) GLUT1 (green) and SCA1 (red), or (D) PECAM1 (green) and ID1 (red) in normal cerebellar vessels of WT mice and vascular lesions (dotted area) of both iCCM1 and iCCM1/KLF4 mice (n = 4 in each group). PECAM1 identifies ECs; DAPI visualizes nuclei. Scale bars: 50 μm.