. 2015 Oct 20;7(43):18030–18035. doi: 10.1039/c5nr04982b

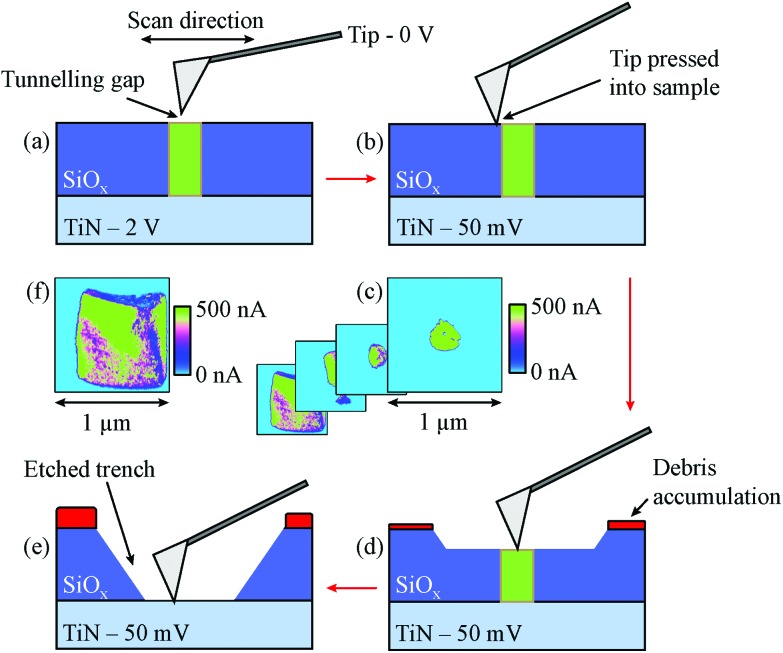
Fig. 2. Schematic representation of the depth profiling process. (a) Filaments are located by performing a CAFM scan with a low setpoint voltage to detect conductive spots in insulating areas. Due to the tunnelling gap in these scans, a relatively high scanning bias of 2 V is applied between the tip and sample. (b) Once the filament has been located, the setpoint voltage is increased, causing the feedback system of the microscope to push the cantilever tip into the sample surface. The applied bias is also lowered to 50 mV as the tunnelling gap is removed. (c) and (d) As the region is raster scanned, a two-dimensional current map is acquired. Through repeated scanning of the same area, a trench is etched as material is removed from the SiOx and accumulated at the edge of the scan region. This results in a set of current map image slices through the active layer that may be later rendered into a tomographic image. (e) Eventually the CAFM tip reaches the bottom TiN electrode. (f) At the bottom of the final trench the current map becomes roughly a square, corresponding to a scan of the conductive electrode.

Fig. 2