FIGURE 2.
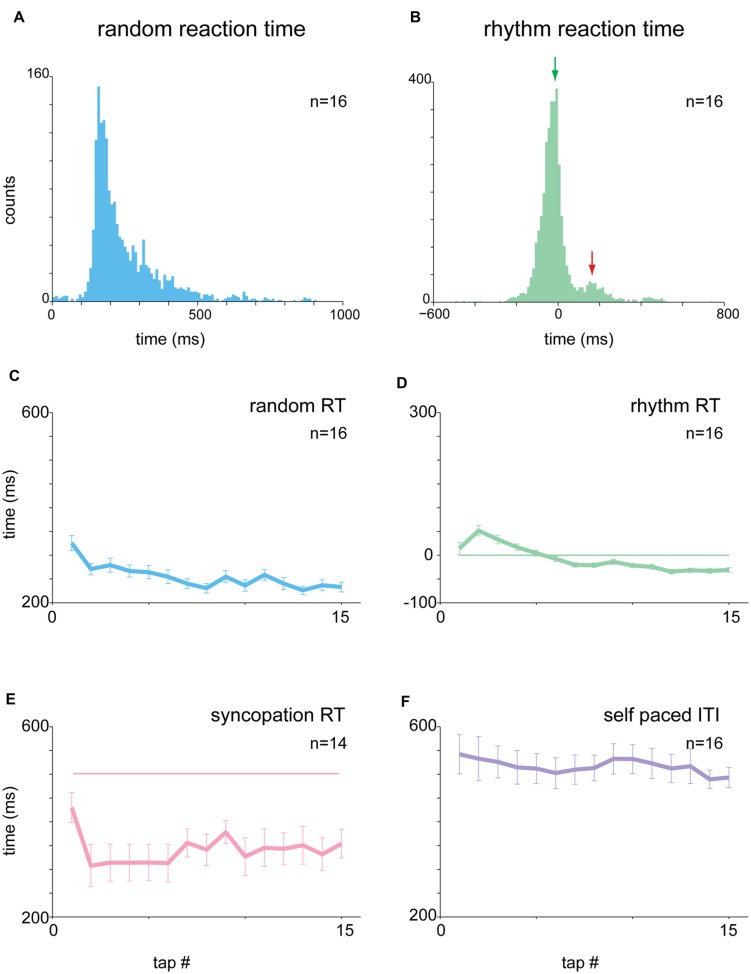
Analysis of reaction times (RTs). (A) Distribution of RTs in random tapping. RT was at least +50 ms and exhibited a broad range of values (median = 163.4 ms). (B) Distribution of RTs in 1 and 2 Hz blocks. The histogram consisted of two subgroups: a negative asynchrony group (RT ≤ 0, green arrow) and a reactive group (RT > 0, red arrow). (C–E) Tap-dependent modulation of RT in random tapping (C), rhythmic tapping (D), and syncopation trials (E). In (E), the pink horizontal straight line marks the expected interval for syncopation which was 500 ms in the 1 Hz task. (F) Tap-dependent modulations of inter tap interval (ITI) in self-paced tapping. Plots showing RT as a function of tap number are not in the same Y-scale, but all have the same range of values (400 ms). The number of subjects is shown for each panel. Note, however, that each subject contributed multiple RT values. Data taken from experimental set B.

