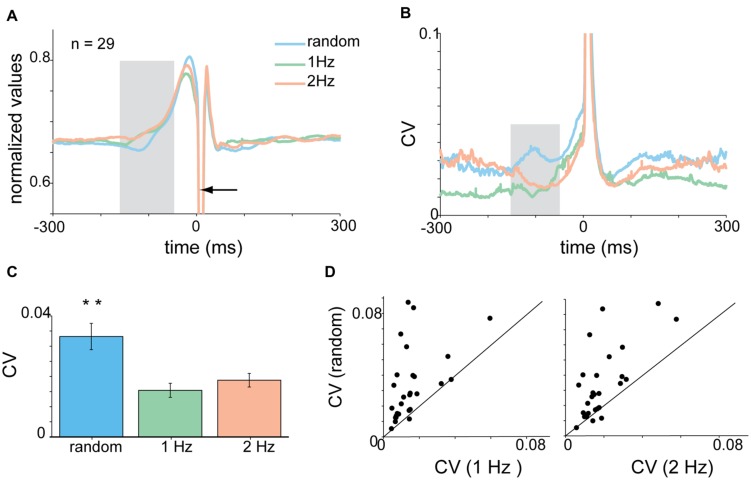
FIGURE 3.
Context-dependent changes in acceleration profile. (A) Mean acceleration profile of all subjects (n = 28) centered on time of tap. Shaded area corresponds to pre-tap window where random data were significantly different from the 1 and 2 Hz data. (B) Same as A, but showing the mean CVt computed for the acceleration signal. (C) Mean CV for all subjects computed for the test window (-150 to -50 ms before the tap) during the different task conditions. Mean CV for random tapping was higher than both rhythm condition values (Kruskal–Wallis p < 0.01). (D) Single subject comparison of CV values found in random vs. rhythmic taps obtained in 1 Hz (left) and 2 Hz (right) tapping. Unity line (x = y) is shown as well. For the majority of the subjects the values of the random taps were higher than both 1 and 2 Hz rhythmic tapping. Data taken from experimental set A and B. ∗p < 0.05, ∗∗p < 0.01.

