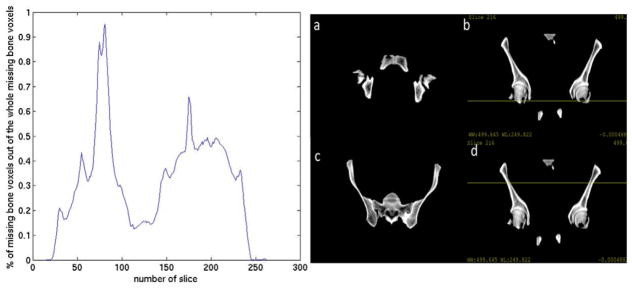
Figure 11.
Analysis of the location of missing bone voxels. Left: percentage of missing bone voxels in each axial slice, two peaks appear at slice 81 and slice 175. Right: (a) axial slice 81 of the reference image. (b) Coronal plane with yellow line corresponding to axial slice 81. (c) Axial slice 175 of the reference image. (d) Coronal plane with yellow line corresponding to axial slice 175.

