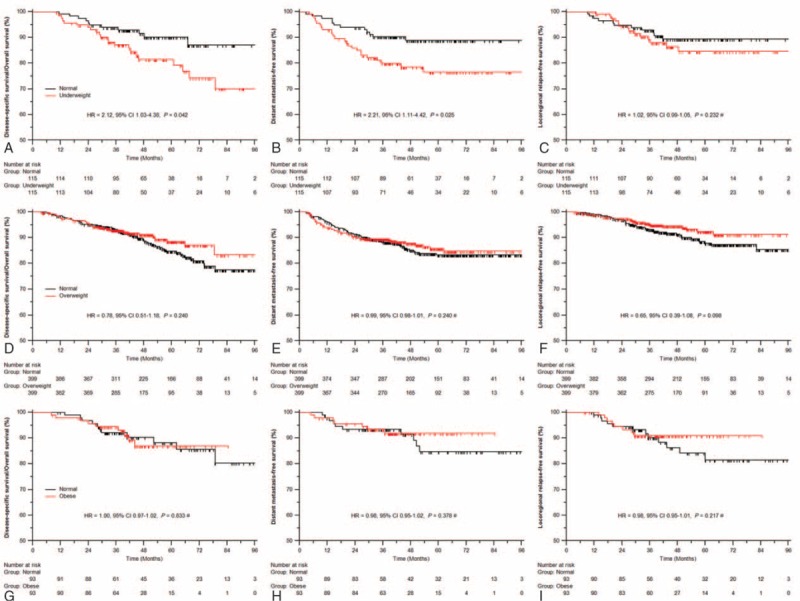
FIGURE 1.

Comparison outcomes of survival: underweight versus normal weight (A–C), overweight versus normal weight (D–F), and obesity versus normal weight (G–I). ∗ Cox regression model with time-dependent covariates.

Comparison outcomes of survival: underweight versus normal weight (A–C), overweight versus normal weight (D–F), and obesity versus normal weight (G–I). ∗ Cox regression model with time-dependent covariates.