
FIGURE 2.
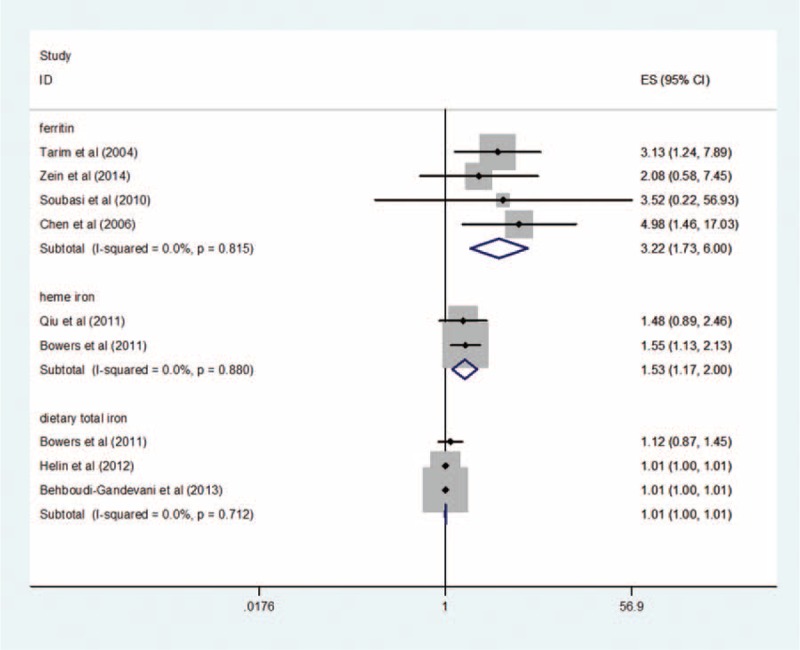
Forest plot of the relationship between ferritin, heme iron, dietary total iron levels, and GDM risk, comparing only the highest category with the lowest. The presented summary estimate was calculated using an inverse-variance fixed-effect model.