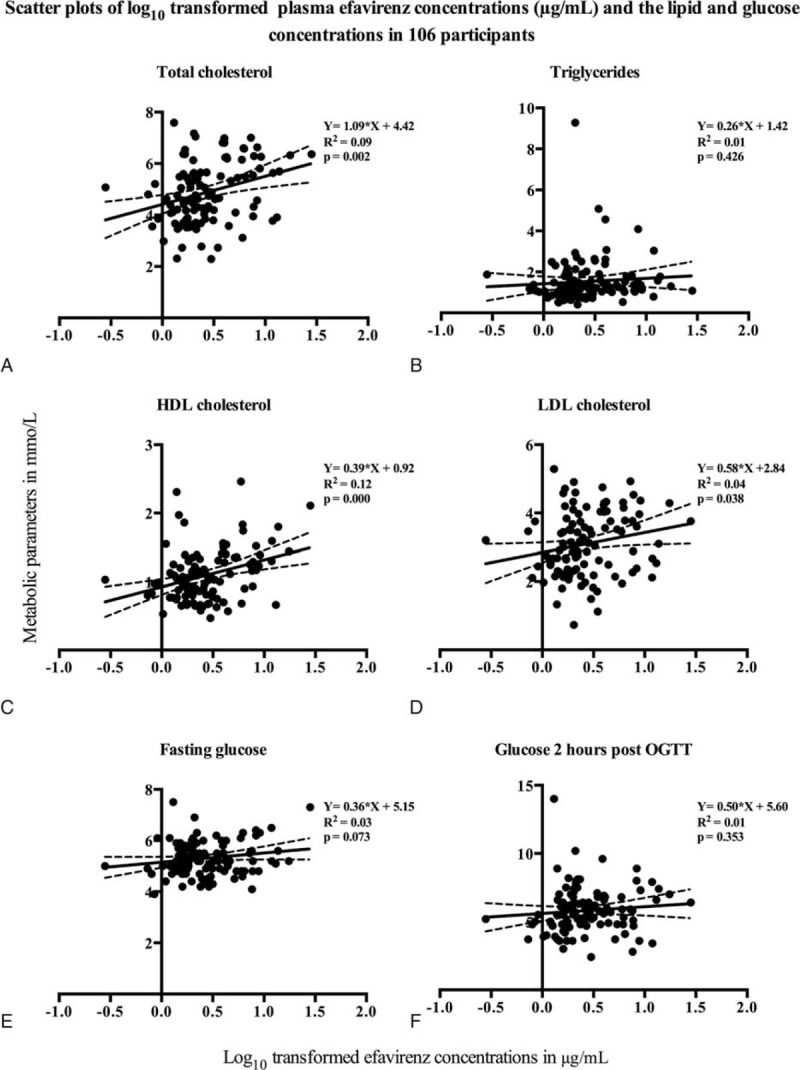
FIGURE 1.

Scatter plots of log10 transformed plasma efavirenz concentrations (μg/mL) and the lipid and glucose concentrations in 106 participants. The x-axes represent log10 transformed plasma efavirenz concentrations. The y-axes represent concentrations of each metabolic parameter—(A) fasting total cholesterol, (B) fasting triglycerides, (C) fasting HDL cholesterol, (D) fasting LDL cholesterol, (E) fasting glucose, and (F) glucose 2 h post oral glucose tolerance test. Each black marker denotes an individual lipid or glucose concentration plotted against the plasma efavirenz concentrations in 106 participants. The solid black line indicates the regression line, with the 95% confidence interval shown in dotted lines. The equations for the regression line (with the slope and y intercept), correlation determinants (R2), and P values are shown on each plot. LDL = low-density lipoprotein, HDL = high-density lipoprotein.
