FIGURE 6.

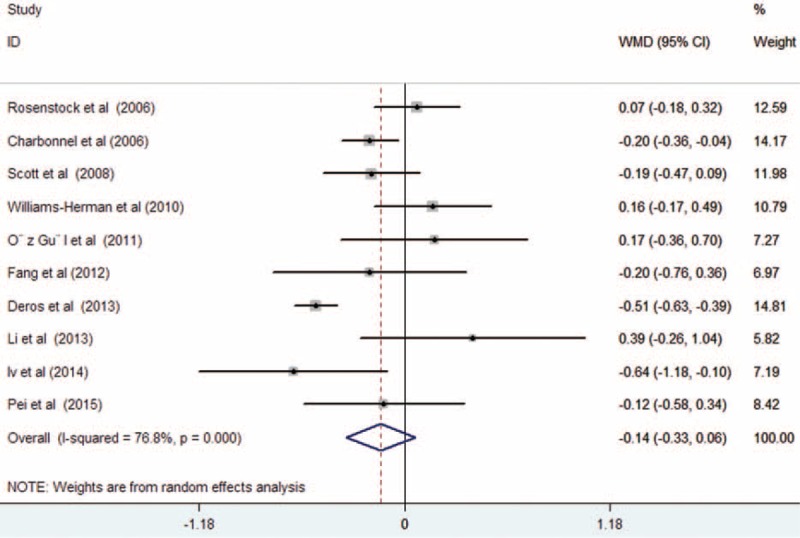
Forest plots showing weighted mean difference and 95% confidence interval for serum total cholesterol levels comparing sitagliptin alone or in combination with other antihyperglycemic agents to controls in a random effects model.

Forest plots showing weighted mean difference and 95% confidence interval for serum total cholesterol levels comparing sitagliptin alone or in combination with other antihyperglycemic agents to controls in a random effects model.