
FIGURE 2.
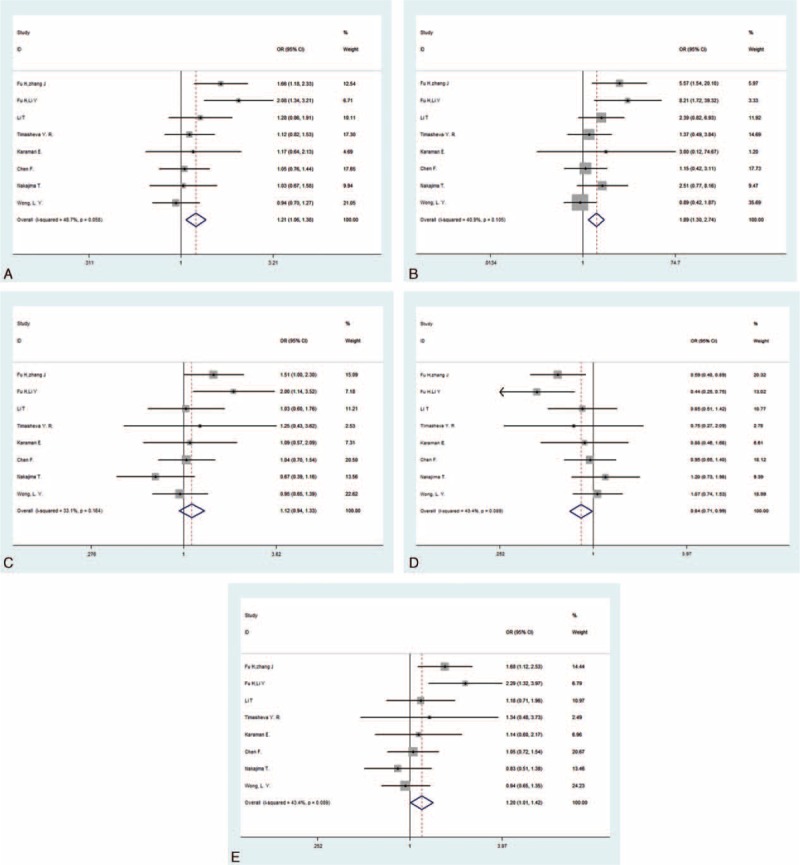
Forest plots for −572 C>G polymorphism in the overall analysis. The summary pooled ORs and 95% CIs are indicated by the white diamonds. (A) Allelic comparison (G vs C); (B) homozygote comparison (GG vs CC); (C) heterozygote comparison (CG vs CC); (D) dominant model (GG + CG vs CC); (E) recessive model (GG vs CG + CC).CI = confidence interval, OR = odds ratio.