
FIGURE 5.
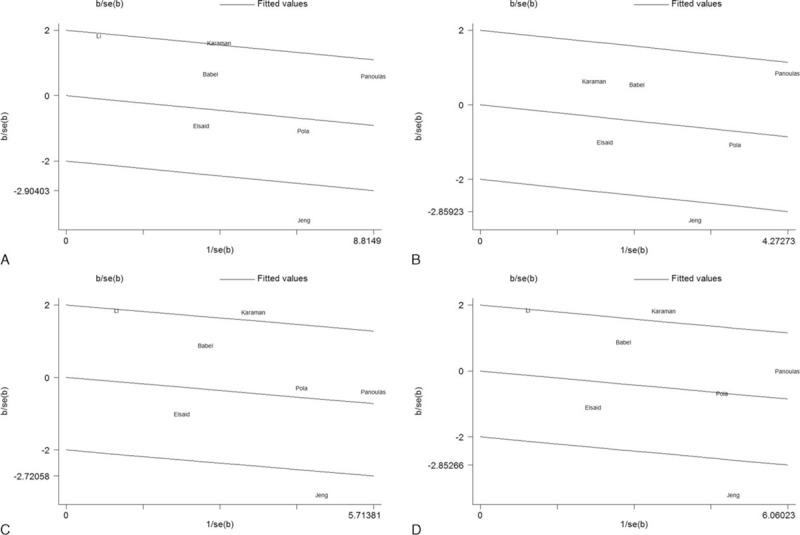
Galbraith plots for −174 G>C polymorphism in the overall analysis. The outlier dots indicate the main contributors to heterogeneity. (A) Allelic comparison (C vs G); (B) homozygote comparison (CC vs GG); (C) heterozygote comparison (GC vs GG); (D) dominant model (CC + GC vs GG). SE = standard error.