Abstract
We aimed to elucidate the incidence of protein–energy malnutrition (PEM) in patients with chronic liver disease and to identify factors linked to the presence of PEM.
A total of 432 patients with chronic liver disease were analyzed in the current analysis. We defined patients with serum albumin level of ≤3.5 g/dL and nonprotein respiratory quotient (npRQ) value using indirect calorimetry less than 0.85 as those with PEM. We compared between patients with PEM and those without PEM in baseline characteristics and examined factors linked to the presence of PEM using univariate and multivariate analyses.
There are 216 patients with chronic hepatitis, 123 with Child–Pugh A, 80 with Child–Pugh B, and 13 with Child–Pugh C. Six patients (2.8%) had PEM in patients with chronic hepatitis, 17 (13.8%) in patients with Child–Pugh A, 42 (52.5%) in patients with Child–Pugh B, and 10 (76.9%) in patients with Child–Pugh C (P < 0.001). Multivariate analysis revealed that Child–Pugh classification (P < 0.001), age ≥64 years (P = 0.0428), aspartate aminotransferase (AST) ≥40 IU/L (P = 0.0023), and branched-chain amino acid to tyrosine ratio (BTR) ≤5.2 (P = 0.0328) were independent predictors linked to the presence of PEM. On the basis of numbers of above risk factors (age, AST, and BTR), the proportions of patients with PEM were well stratified especially in patients with early chronic hepatitis or Child–Pugh A (n = 339, P < 0.0001), while the proportions of patients with PEM tended to be well stratified in patients with Child–Pugh B or C (n = 93, P = 0.0673).
Age, AST, and BTR can be useful markers for identifying PEM especially in patients with early stage of chronic liver disease.
INTRODUCTION
The liver plays a unique role in carbohydrate metabolism by maintaining glucose concentration levels in the normal range and it is also an essential organ for the metabolism of three major nutrients: protein, fat, and carbohydrate.1–5 Liver cirrhosis (LC), which develops over a long period of time due to chronic inflammation, is often complicated with protein–energy malnutrition (PEM).1,2,6 PEM is one of the most common complications in LC patients.1,2,6 PEM is associated with an increased risk of complications, including ascites, variceal bleeding, hepatic encephalopathy, and hepatorenal syndrome, and thus, it is linked to high morbidity and mortality for LC patients.1,2,4,6–9 Predicting the presence of PEM and appropriate nutritional support is therefore essential for improving prognosis in chronic liver disease patients with PEM.
Protein malnutrition can be assessed using serum albumin value.10,11 It has been demonstrated that, in metabolic disorders of protein, the degradation and synthesis rates of albumin decreased and the half-life of serum albumin became longer.12 In general, patients with serum albumin value of ≤3.5 g/dL are considered to have protein malnutrition and it is easily tested in clinical practice, although a previous study reported that conventional definition of hypoalbuminemia as a serum albumin level of ≤3.5 g/dL should be reconsidered.10,11,13 On the contrary, measurement of nonprotein respiratory quotient (npRQ) using indirect calorimetry for assessing the degree of energy malnutrition is highly limited in daily clinical practice due to the high cost for indirect calorimetry. Thus, other alternative markers will be needed for predicting the presence of PEM.14 Particularly, in early stages of chronic liver disease such as chronic hepatitis and Child–Pugh A, the presence of PEM tends to be overlooked, leading to the delay of initiation of nutritional support.15 In addition, PEM is linked to sarcopenia, which is characterized by the depletion of skeletal muscle mass and negatively effect on survival and quality of life in patients with LC and has thus recently attracted attention for clinicians.6,16–18
On the basis of these backgrounds, in the current study, we aimed to elucidate the incidence of PEM in patients with chronic liver disease and to identify factors linked to the presence of PEM.
PATIENTS AND METHODS
Patients
Between October 2005 and January 2012, nutritional evaluation was performed in a total of 600 patients with chronic liver disease at the Division of Hepatobiliary and Pancreatic disease, Department of Internal Medicine, Hyogo College of Medicine, Hyogo, Japan, using indirect calorimetry, anthropometry, and/or bio-electrical impedance analysis. Of these, indirect calorimetry was used for nutritional assessment in 494 patients. In the current analysis, we included the following variables into analysis: age, gender, cause of liver disease, body mass index (BMI), degree of liver fibrosis using liver biopsy sample, serum albumin, total bilirubin, aspartate aminotransferase (AST), alanine aminotransferase (ALT), fasting blood sugar, total cholesterol, triglyceride, HbA1c, homeostasis model assessment-insulin resistance (HOMA-IR), branched-chain amino acid (BCAA) to tyrosine ratio (BTR). Only subjects with all these data available were included in our analysis. Thus, a total of 432 patients were analyzed in this study (Figure 1). Patients excluded from the current analysis had comparable baseline characteristics as compared with those analyzed in this study.
FIGURE 1.
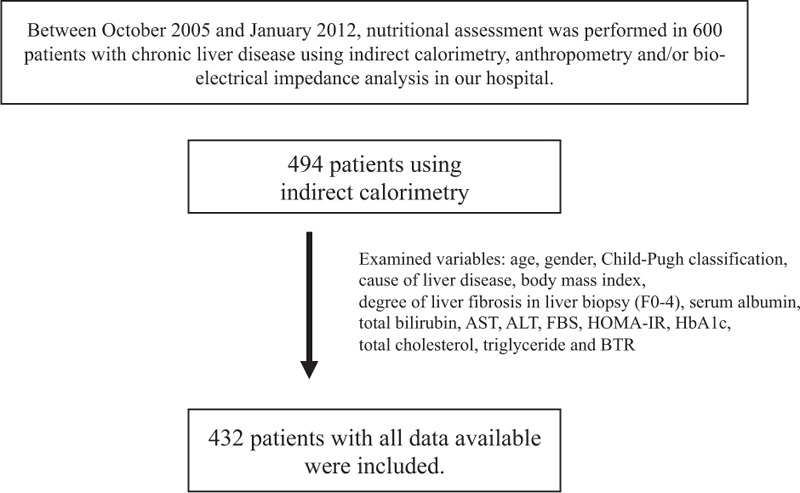
Study design. ALT, alanine aminotransferase, AST, aspartate aminotransferase, BTR, branched-chain amino acid (BCAA) to tyrosine ratio, FBS, fasting blood sugar, HOMA-IR, homeostasis model assessment-insulin resistance.
We defined patients with serum albumin level of ≤3.5 g/dL and npRQ less than 0.85 as those with PEM according to the previous reports.19,20 We retrospectively investigated the energy metabolism and the proportion of patients with PEM in our cohort. In addition, we compared the baseline characteristics of patients with and without PEM and examined factors linked to the presence of PEM using univariate and multivariate analyses.
Liver biopsy samples were routinely obtained using percutaneous liver biopsy methods and well-trained pathologists in our hospital assessed the samples. Degree of fibrosis stages (F0–4) were assessed according to the METAVIR scoring system.21,22 In performing liver biopsy, procedure-related death was not observed in all analyzed cases.
The ethics committee of Hyogo College of Medicine, Japan, approved the current study protocol and this study protocol complied with all of the provisions of the Declaration of Helsinki. Written informed consent was obtained from all subjects before assessing nutritional status using indirect calorimetry.
Indirect Calorimetry
Parameters measured by indirect calorimetry are carbon dioxide production per minute (VCO2) and oxygen consumption per minute (VO2). Total urinary excretion of nitrogen (UN) was measured as reported previously.19,23 npRQ, rest energy expenditure (REE), substrate oxidation rates of fat (%F), carbohydrate (%C), and protein (%P) were calculated using following formulas: npRQ = (1.44VCO2 – 4.890 UN)/(1.44 VO2 – 6.04 UN); REE (kcal/day) = 5.50 VO2 + 1.76 VCO2 – 1.99 UN; F (g/24 hour) = 2.432 VO2 + 2.432 VCO2 – 1.943 UN; C (g/24 hour) = 5.926 VO2 + 4.189 VCO2 – 2.539 UN; P (g/24 hour) = 6.250 UN; %F = 9.46F/REE × 100; %C = 4.18C/REE × 100; %P = 4.32P/REE × 100.19,23–26 REE was determined for all subjects in the morning after an overnight fast (12 hours).
Statistical Analysis
In continuous variables, the statistical analysis among groups was performed using Student t test or Kruskal–Wallis test, as appropriate. Categorical variables were compared using Fisher exact tests or Pearson χ2 test, as appropriate. Data were analyzed using univariate and multivariate analyses. Factors associated with the presence of PEM, defined as P <0.05 in univariate analyses, were entered into multivariate logistic regression analysis. To analyze the significance of predictors of PEM in multivariate analysis, continuous variables were divided by the median values for all cases (n = 432) and treated as dichotomous covariates. Data are expressed as means ± standard deviation (SD) or median value (range). Values of P < 0.05 were considered to be statistically significant. Statistical analysis was performed with the JMP 9 (SAS Institute Inc., Cary, NC).
RESULTS
Baseline Characteristics
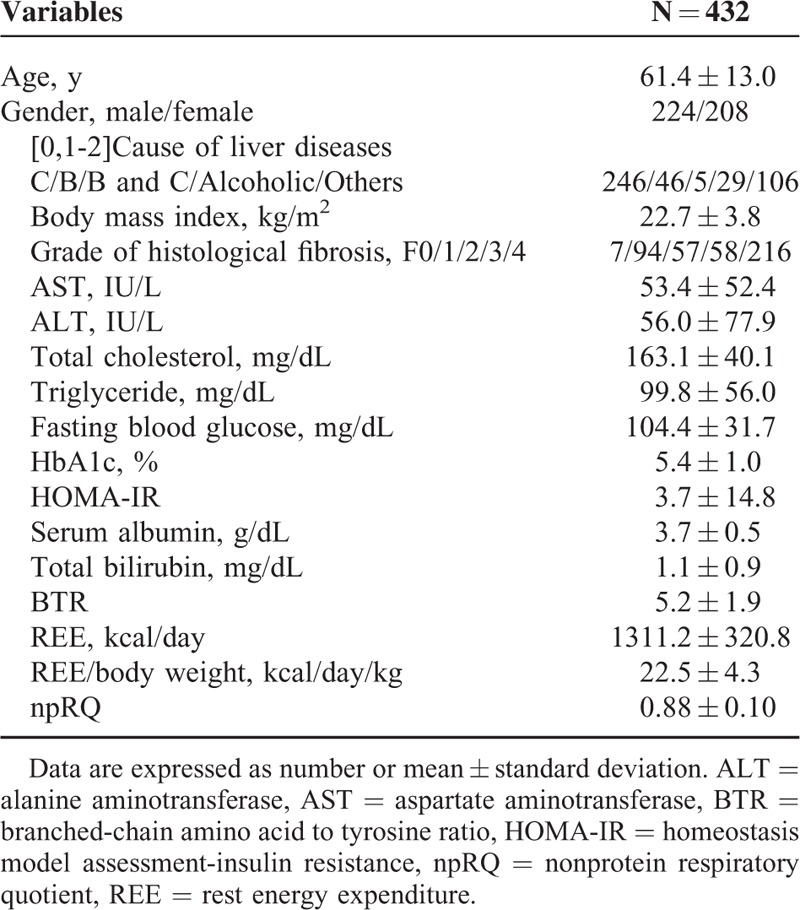
The baseline characteristics in the present study (n = 432) are summarized in Table 1. They included 224 males and 208 females. The mean (±SD) age was 61.4 ± 13.0 years. As for cause of background liver disease, there are 246 subjects in hepatitis C, 46 in hepatitis B, 6 in hepatitis B and C, 29 in alcoholic liver injury, and 106 in others. Others included autoimmune hepatitis, primary biliary cirrhosis, nonalcoholic steatohepatitis, nonalcoholic fatty liver disease, and cryptogenic chronic liver disease. In terms of degree of liver fibrosis, there are 7 subjects in F0, 94 in F1, 57 in F2, 58 in F3, and 216 in F4. In patients with F4, they included 123 patients with Child–Pugh A, 80 with Child–Pugh B, and 13 with Child–Pugh C.
TABLE 1.
Baseline Characteristics in the Present Analysis (n = 432)
npRQ Value According to the Degree of Liver Function
The median values (range) of npRQ in each group are as follows: 0.89 (0.63–1.37) in chronic hepatitis, 0.86 (0.66–1.23) in Child–Pugh A, 0.84 (0.71–1.30) in Child–Pugh B, and 0.82 (0.73–1.00) in Child–Pugh C (P < 0.0001) (Figure 2).
FIGURE 2.
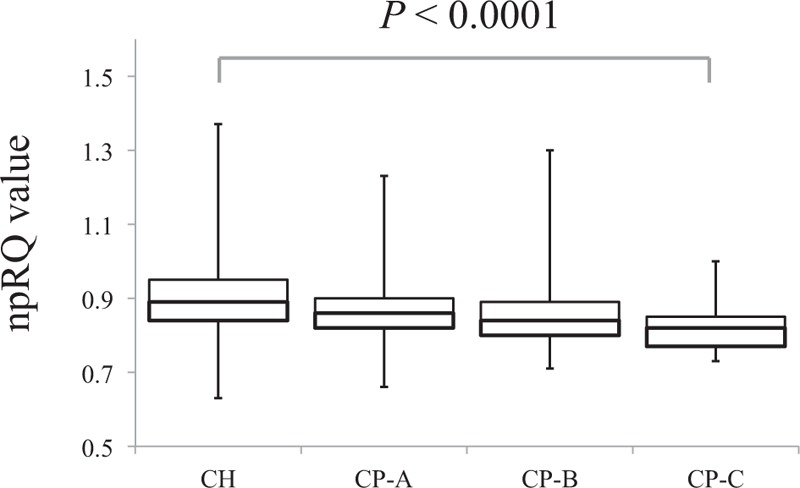
npRQ value according to the degree of liver function, presented by box plots. The median values (range) of npRQ are 0.89 (0.63–1.37) in chronic hepatitis, 0.86 (0.66–1.23) in Child–Pugh A, 0.84 (0.71–1.30) in Child–Pugh B, and 0.82 (0.73–1.00) in Child–Pugh C. As the liver function deteriorates, npRQ values significantly decreased (P < 0.0001).
Energy Metabolism Based on the Degree of Liver Function
Data for energy metabolism based on the degree of liver function are (all data are presented with mean value): 12.7% in the %C, 29.2% in the %F, and 58.1% in the %P in patients with chronic hepatitis; 12.4% in the %C, 40.3% in the %F, and 47.3% in the %P in patients with Child–Pugh A; 10.7% in the %C, 40.7% in the %F, and 48.6% in the %P in patients with Child–Pugh B; and 9.0% in the %C, 54.5% in the %F, and 36.5% in the %P in patients with Child–Pugh C. As the liver function deteriorates, the %C gradually decreased and the %F gradually increased (Figure 3).
FIGURE 3.
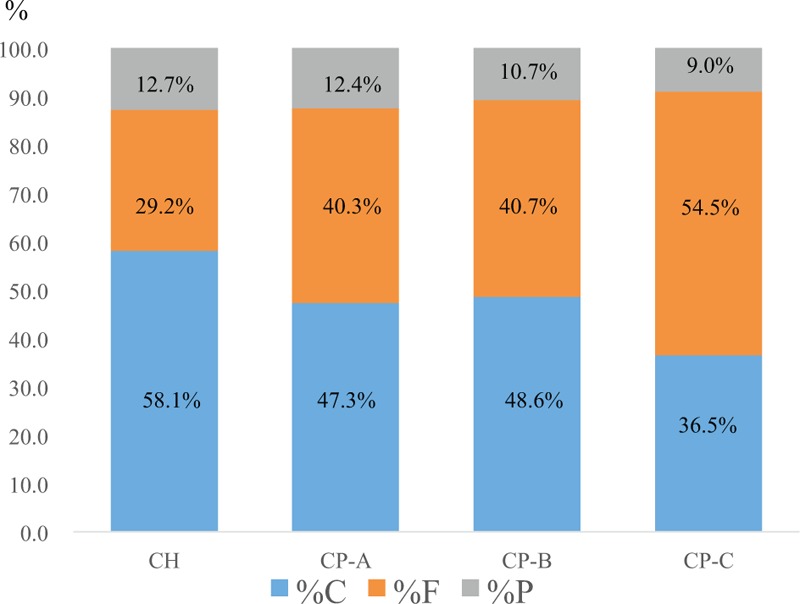
Energy metabolism according to the degree of liver function. %F, %C, and %P, substrate oxidation rates of fat, carbohydrate, and protein. The %C gradually decreased and the %F gradually increased as the liver functional reserve deteriorates.
Proportion of Patients With PEM According to the Degree of Liver Function
Six out of 216 patients (2.8%) had PEM in patients with chronic hepatitis (F0-F3), 17 out of 123 (13.8%) in patients with Child–Pugh A, 42 out of 80 (52.5%) in patients with Child–Pugh B, and 10 out of 13 (76.9%) in patients with Child–Pugh C (P < 0.001) (Figure 4A). Thus, in LC patients (n = 216), the proportion of patients with PEM was 31.9% (69/216). In patients with chronic hepatitis and PEM (n = 6), the degree of liver fibrosis is F1 in 2 patients, F2 in 3, and F3 in 1.
FIGURE 4.
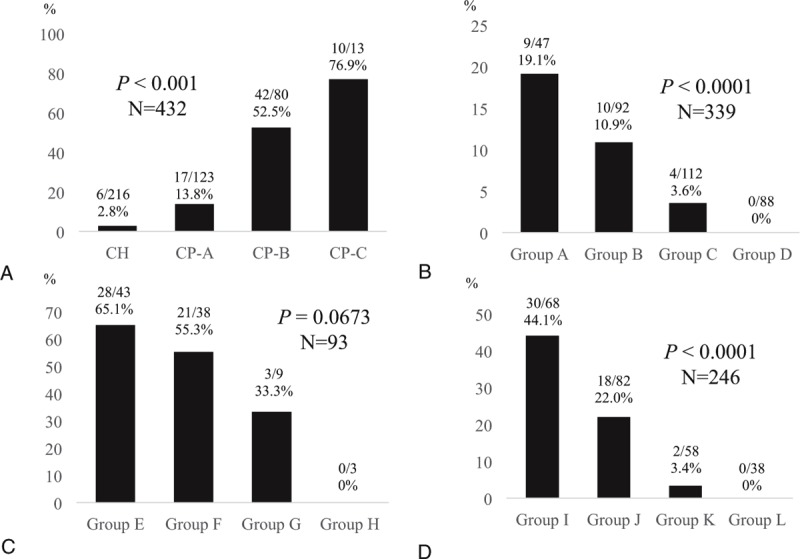
A, Proportion of patients with PEM according to the degree of liver function. The proportion of patients with PEM significantly increased as the liver function deteriorates (P < 0.0001). B, The proportion of patients with PEM based on numbers of significant factors in our multivariate analysis (age ≥64 years, AST ≥40 IU/L, and BTR ≤5.2) in patients with chronic hepatitis or Child–Pugh A (n = 339). Group A means patients with age ≥64 years, AST ≥40 IU/L, and BTR ≤5.2. Group B means patients who had any 2 factors out of the above 3 factors. Group C means patients who had any 1 factor out of 3 factors. Group D means patients who had none of 3 factors. The proportion of PEM among four groups were significantly stratified (P < 0.0001). C, The proportion of patients with PEM based on numbers of significant factors in our multivariate analysis (age ≥64 years, AST ≥40 IU/L, and BTR ≤5.2) in patients with Child–Pugh B or C (n = 93). Group E means patients with age ≥64 years, AST ≥40 IU/L, and BTR ≤5.2. Group F means patients who had any 2 factors out of the above 3 factors. Group G means patients who had any 1 factor out of 3 factors. Group H means patients who had none of 3 factors. The proportion of PEM among 4 groups tended to be significantly stratified (P = 0.0673). D, The proportion of patients with PEM based on numbers of significant factors in our multivariate analysis (age ≥64 years, AST ≥40 IU/L, and BTR ≤ 5.2) in patients with chronic hepatitis C related liver disease (n = 246). Group I means patients with age ≥64 years, AST ≥40 IU/L, and BTR ≤5.2. Group J means patients who had any 2 factors out of the above 3 factors. Group K means patients who had any 1 factor out of 3 factors. Group L means patients who had none of 3 factors. The proportion of PEM among 4 groups were significantly stratified (P < 0.0001).
Univariate and Multivariate Analyses of Factors Associated With the Presence of PEM
Univariate analysis identified the following factors as significantly associated with the presence of PEM for all cases (n = 432): age (P < 0.0001); degree of liver function (P < 0.0001); AST (P = 0.0016); total bilirubin (P = 0.0026); total cholesterol (P < 0.0001); triglyceride (P < 0.0001); HbA1c (P = 0.0016); and BTR (P < 0.0001) (Table 2). The hazard ratios and 95% confidence intervals calculated using multivariate analysis for the eight factors with P <0.05 in univariate analysis are detailed in Table 3. Age ≥64 years (P = 0.0428), Child–Pugh classification (P < 0.0001), AST ≥40 IU/L (P = 0.0023), and BTR ≤5.2 (P = 0.0328) were found to be significant prognostic factors linked to the presence of PEM.
TABLE 2.
Comparison of Baseline Characteristics Between Patients With Protein–Energy Malnutrition (PEM) (n = 75) and Those Without PEM (n = 357)
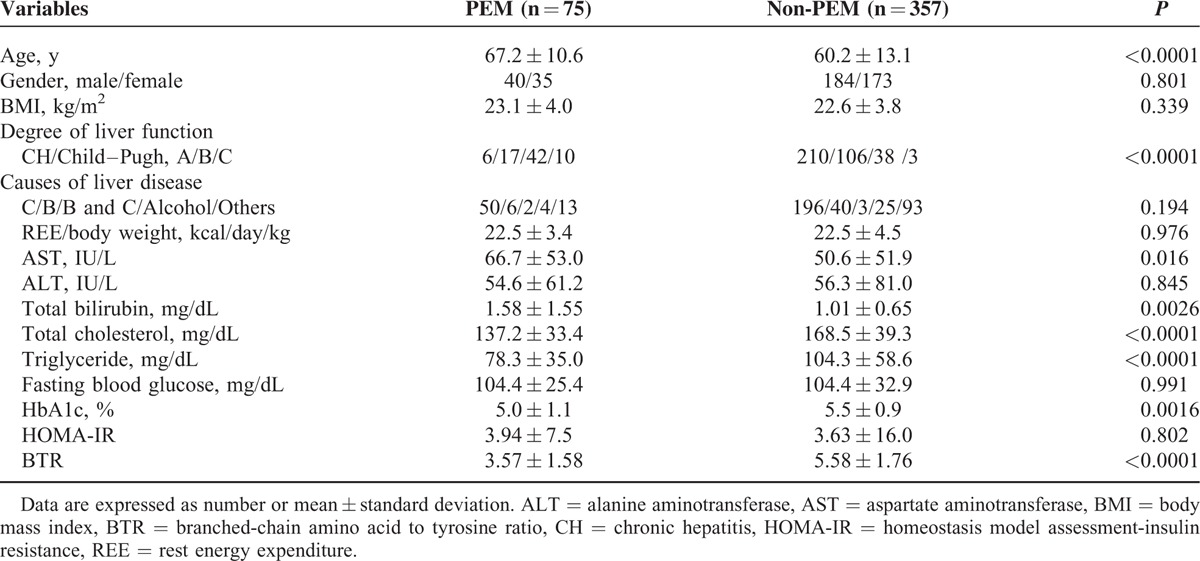
TABLE 3.
Multivariate Analysis of Factors Contributing to the Presence of Protein–Energy Malnutrition

The Proportion of Patients With PEM Based on Numbers of Significant Factors in Multivariate Analysis (Age, AST Value, and BTR Value) in Patients With Chronic Hepatitis or Child–Pugh A (n = 339) and Those With Child–Pugh B or C (n = 93) and Those With HCV-positive Status (n = 246)
As in our multivariate analysis, age, AST value, and BTR value as well as Child–Pugh classification were found to be independent predictors linked to the presence of PEM, we performed subgroup analyses based on numbers of significant variables (age, AST, and BTR) in patients with chronic hepatitis or Child–Pugh A (n = 339) and those with Child–Pugh B or C (n = 93) and those with HCV-positive status (n = 246).
In patients with chronic hepatitis or Child–Pugh A (n = 339), the proportion of patients with PEM in those with age ≥64 years, AST ≥40 IU/L, and BTR ≤ 5.2 was 19.1% (9/47), while 10.9% (10/92) in those who had any 2 factors out of the above 3 significant factors, 3.6% (4/112) in those who had any 1 factor out of 3 factors, and 0% (0/88) in those who had none of 3 factors (P < 0.0001) (Figure 4B).
In patients with Child–Pugh B or C (n = 93), the proportion of patients with PEM in those with 3 significant factors was 65.1% (28/43), while 55.3% (21/38) in those who had any 2 factors out of 3 factors, 33.3% (3/9) in those who had any 1 factor out of 3 factors, and 0% (0/3) in those who had none of 3 factors (P = 0.0673) (Figure 4C).
In patients with HCV-related liver disease (n = 246), the proportion of patients with PEM in those with age ≥64 years, AST ≥40 IU/L, and BTR ≤5.2 was 44.1% (30/68), while 22.0% (18/82) in those who had any 2 factors out of the above 3 significant factors, 3.4% (2/58) in those who had any 1 factor out of 3 factors, and 0% (0/38) in those who had none of 3 factors (P < 0.0001) (Figure 4D).
DISCUSSION
To the best of our knowledge, this is the largest study for investigating nutritional status using indirect calorimetry in patients with chronic liver disease. As mentioned earlier, indirect calorimetry is expensive and clinicians are not usually familiar with this and PEM is closely associated with sarcopenia, which is reported to be an adverse predictive factor in patients with LC.6,16–18 Thus, other alternative markers often used in daily clinical practice for predicting presence of PEM will be required for adequate nutritional support. Hence, we conducted the current analysis.
Our multivariate analysis revealed that Child–Pugh classification, age, AST value, and BTR value, which are available in clinical settings, were independent predictors linked to the presence of PEM and we demonstrated that using these variables, the risk groups of developing PEM were well stratified especially in patients with early stages of chronic liver disease. Despite its importance, PEM is often underdiagnosed in patients with chronic liver disease, particularly in the early stages of disease such as chronic hepatitis or Child–Pugh A.15 Furthermore, in our results, it is of note that in patients who had none of 3 risk factors of age ≥64 years, AST ≥40 IU/L, and BTR ≤ 5.2, there was no patient with PEM in groups of chronic hepatitis or Child–Pugh A (n = 88) and Child–Pugh B or C (n = 3) and HCV-related liver disease (n = 38). This seems to provide useful information for clinicians in daily clinical practice. Our results shed some light on identifying patients with PEM and those without PEM in the field of chronic liver disease. Patients with our proposed multiple risk factors are potentially candidate for nutritional support, as they are expected to be complicated with PEM even if they are in the early stage of chronic liver disease.10,11 On the other hand, contrary to our expectations, HOMA-IR was not a significant factor related to the presence of PEM and HbA1c value in the PEM group was significantly lower than that in the non-PEM group despite the fact that advanced liver fibrosis causes insulin resistance.27,28 The reasons for these are unclear; however, liver function itself rather than insulin resistance may be associated with development of PEM.
Previous data have shown that LC patients often develop PEM at a rate of 25.1% to 65.5%,7,22,29–32 although in our data, the proportion of PEM in LC patients was 31.9%. In 2002, Tajika et al19 (Japanese investigators) reported that the proportion of PEM in LC patients was around 50%, which is significantly higher than our data. Due to the differences of baseline characteristics between our data and data of Tajika et al,19 direct comparison in these 2 studies is difficult; however, the fact that eating habits in Japanese persons have changed and the advancement of therapy for LC patients in the last decade may explain these discrepancies.3,20,33
In our data of energy metabolism in indirect calorimetry, the %C gradually decreased and the %F gradually increased and npRQ value significantly decreased as the liver functional reserve deteriorates. As LC patients have poorer glycogen stores capacity and gluconeogenesis ability, they are prone to entering into a starvation state after an overnight fasting period.1,14,16,34–36 In this situation, lipid metabolism is enhanced; energy metabolism shifts from a carbohydrate preference to lipid oxidation preference and it is well accepted that decreased glucose oxidation and increased fat oxidation are associated with reduction of npRQ value in LC patients.1,14,16,34 Our results were consistent with previous reports.19
With the recent high prevalence of persons with obesity, the number of obese LC patients has been increasing.16 In our results, BMI was not a significant factor linked to the presence of PEM. In our data, the proportions of patients with BMI >25 kg/m2, which is defined as obesity in our country, were 29.3% (22/75) in the PEM group and 21.8% (78/357) in the non-PEM group in our cohort.37 Although BMI is a simple anthropometric index, BMI is limited anthropometrically, as it does not evaluate individual components of body weight such as muscle volume or regional fat distribution.38 In that sense, BMI may not be useful for predicting PEM. Instead, sarcopenic obesity derived from excess adiposity (obesity) and low muscle mass (sarcopenia), which is an adverse predictor for LC patients, may be attributed to our results.39,40 On the contrary, in patients with BMI >25 kg/m2 (n = 100), 65 (65.0%) had HOMA-IR ≥2.5. Furthermore, in limited patients with LC and BMI >25 kg/m2 (n = 56), 40 (71.4%) had HOMA-IR ≥2.5 in our study. Obesity and insulin resistance in LC patients are significant problem, as it can cause liver fibrosis progression and liver carcinogenesis, although this is beyond the scope of our current analysis.16,27
There are several limitations in this study. First, this study is a retrospective observational study. Second, in performing liver biopsy, sampling errors for evaluating the degree of liver fibrosis can occur. Third, npRQ value may be influenced by characteristics of diet or recent physical activity in each patient. Thus, we should interpret our current results with caution. However, in the current analysis, we demonstrated that age, AST value, and BTR value are significant predictors for the presence of PEM as well as Child–Pugh classification using large sample size. In conclusion, especially in early stage of chronic liver disease, such variables can be useful for identifying patients with PEM and those without PEM.
Acknowledgment
The authors would like to thank all medical staff in our nutritional guidance room for data collection.
Footnotes
Abbreviations: %C = substrate oxidation of carbohydrate; %F = substrate oxidation rates of fat; %P = substrate oxidation of protein; ALT = alanine aminotransferase; AST = aspartate aminotransferase; BMI = body mass index; BTR = branched-chain amino acid (BCAA) to tyrosine ratio; HOMA-IR = homeostasis model assessment-insulin resistance; LC = liver cirrhosis; npRQ = non-protein respiratory quotient; PEM = protein-energy malnutrition; REE = rest energy expenditure; UN = urinary excretion of nitrogen; VCO2 = carbon dioxide production per minute; VO2 = oxygen consumption per minute.
In the past year, Shuhei Nishiguchi received financial support from Chugai Pharmaceutical, MSD, Dainippon Sumitomo Pharma, Ajinomoto Pharma, and Otsuka Pharmaceutical. The remaining authors declare that they have no conflicts of interest.
Hiroki Nishikawa and Kazunori Yoh equally contributed to this work.
The authors have no funding and conflicts of interest to disclose.
REFERENCES
- 1.Moriwaki H, Miwa Y, Tajika M, et al. Branched-chain amino acids as a protein- and energy-source in liver cirrhosis. Biochem Biophys Res Commun 2004; 313:405–409. [DOI] [PubMed] [Google Scholar]
- 2.Charlton MR. Branched-chain amino acid enriched supplements as therapy for liver disease. J Nutr 2006; 136 (1 Suppl):295S–298S. [DOI] [PubMed] [Google Scholar]
- 3.Nishikawa H, Osaki Y. Clinical significance of therapy using branched-chain amino acid granules in patients with liver cirrhosis and hepatocellular carcinoma. Hepatol Res 2014; 44:149–158. [DOI] [PubMed] [Google Scholar]
- 4.Nusrat S, Khan MS, Fazili J, et al. Cirrhosis and its complications: evidence based treatment. World J Gastroenterol 2014; 20:5442–5460. [DOI] [PMC free article] [PubMed] [Google Scholar]
- 5.Kawaguchi T, Izumi N, Charlton MR, et al. Branched-chain amino acids as pharmacological nutrients in chronic liver disease. Hepatology 2011; 54:1063–1070. [DOI] [PubMed] [Google Scholar]
- 6.Hanai T, Shiraki M, Nishimura K, et al. Sarcopenia impairs prognosis of patients with liver cirrhosis. Nutrition 2015; 31:193–199. [DOI] [PubMed] [Google Scholar]
- 7.Peng S, Plank LD, McCall JL, et al. Body composition, muscle function, and energy expenditure in patients with liver cirrhosis: a comprehensive study. Am J Clin Nutr 2007; 85:1257–1266. [DOI] [PubMed] [Google Scholar]
- 8.Mendenhall C, Roselle GA, Gartside P, et al. Relationship of protein calorie malnutrition to alcoholic liver disease: a reexamination of data from two Veterans Administration Cooperative Studies. Alcohol Clin Exp Res 1995; 19:635–641. [DOI] [PubMed] [Google Scholar]
- 9.Huisman EJ, Trip EJ, Siersema PD, et al. Protein energy malnutrition predicts complications in liver cirrhosis. Eur J Gastroenterol Hepatol 2011; 23:982–989. [DOI] [PubMed] [Google Scholar]
- 10.Plauth M, Cabré E, Riggio O, et al. ; DGEM (German Society for Nutritional Medicine), Ferenci P, Holm E, Vom Dahl S, et al; ESPEN (European Society for Parenteral and Enteral Nutrition). ESPEN Guidelines on enteral nutrition: liver disease. Clin Nutr; 2006; 25(2): 285–294. [DOI] [PubMed] [Google Scholar]
- 11.Plauth M, Cabré E, Campillo B, et al. ESPEN. ESPEN Guidelines on parenteral nutrition: hepatology. Clin Nutr 2009; 28:436–444. [DOI] [PubMed] [Google Scholar]
- 12.Kato M, Moriwaki H. Metabolic disorders in patients with liver cirrhosis. Hepatol Res 2004; 30S:59–62. [DOI] [PubMed] [Google Scholar]
- 13.Watanabe A, Matsuzaki S, Moriwaki H, et al. Problems in serum albumin measurement and clinical significance of albumin microheterogeneity in cirrhotics. Nutrition 2004; 20:351–357. [DOI] [PubMed] [Google Scholar]
- 14.Terakura Y, Shiraki M, Nishimura K, et al. Indirect calorimetry and anthropometry to estimate energy metabolism in patients with liver cirrhosis. J Nutr Sci Vitaminol (Tokyo) 2010; 56:372–379. [DOI] [PubMed] [Google Scholar]
- 15.Cabre E, Gassull MA. Nutrition in chronic liver disease and liver transplantation. Curr Opin Clin Nutr Metab Care 1998; 1:423–430. [DOI] [PubMed] [Google Scholar]
- 16.Toshikuni N, Arisawa T, Tsutsumi M. Nutrition and exercise in the management of liver cirrhosis. World J Gastroenterol 2014; 20:7286–7297. [DOI] [PMC free article] [PubMed] [Google Scholar]
- 17.Bémeur C, Butterworth RF. Nutrition in the management of cirrhosis and its neurological complications. J Clin Exp Hepatol 2014; 4:141–150. [DOI] [PMC free article] [PubMed] [Google Scholar]
- 18.Montano-Loza AJ. Clinical relevance of sarcopenia in patients with cirrhosis. World J Gastroenterol 2014; 20:8061–8071. [DOI] [PMC free article] [PubMed] [Google Scholar]
- 19.Tajika M, Kato M, Mohri H, et al. Prognostic value of energy metabolism in patients with viral liver cirrhosis. Nutrition 2002; 18:229–234. [DOI] [PubMed] [Google Scholar]
- 20.Shiraki M, Nishiguchi S, Saito M, et al. Nutritional status and quality of life in current patients with liver cirrhosis as assessed in 2007-2011. Hepatol Res 2013; 43:106–112. [DOI] [PubMed] [Google Scholar]
- 21.The French METAVIR Cooperative Study Group. Intraobserver and interobserver variations in liver biopsy interpretation in patients with chronic hepatitis C. Hepatology 1994; 20 (1 part 1):15–20. [PubMed] [Google Scholar]
- 22.Iwata K, Enomoto H, Nishiguchi S, et al. Serum zinc value in patients with hepatitis virus-related chronic liver disease: association with the histological degree of liver fibrosis and with the severity of varices in compensated cirrhosis. J Clin Biochem Nutr 2014; 55:147–152. [DOI] [PMC free article] [PubMed] [Google Scholar]
- 23.Dickerson RN, Tidwell AC, Minard G, et al. Predicting total urinary nitrogen excretion from urinary urea nitrogen excretion in multiple-trauma patients receiving specialized nutritional support. Nutrition 2005; 21:332–338. [DOI] [PubMed] [Google Scholar]
- 24.Kato M, Miwa Y, Tajika M, et al. Preferential use of branched-chain amino acids as an energy substrate in patients with liver cirrhosis. Intern Med 1998; 37:429–434. [DOI] [PubMed] [Google Scholar]
- 25.Hanai T, Shiraki M, Nishimura K, et al. Free fatty acid as a marker of energy malnutrition in liver cirrhosis. Hepatol Res 2014; 44:218–228. [DOI] [PubMed] [Google Scholar]
- 26.Teramoto A, Yamanaka-Okumura H, Urano E, et al. Comparison of measured and predicted energy expenditure in patients with liver cirrhosis. Asia Pac J Clin Nutr 2014; 23:197–204. [DOI] [PubMed] [Google Scholar]
- 27.Cammà C, Petta S, Di Marco V, et al. Insulin resistance is a risk factor for esophageal varices in hepatitis C virus cirrhosis. Hepatology 2009; 49:195–203. [DOI] [PubMed] [Google Scholar]
- 28.Michelotti GA, Machado MV, Diehl AM. NAFLD, NASH and liver cancer. Nat Rev Gastroenterol Hepatol 2013; 10:656–665. [DOI] [PubMed] [Google Scholar]
- 29.Lautz HU, Selberg O, Körber J, et al. Protein-calorie malnutrition in liver cirrhosis. Clin Investig 1992; 70:478–486. [DOI] [PubMed] [Google Scholar]
- 30.Alvares-da-Silva MR, Reverbel da Silveira T. Comparison between handgrip strength, subjective global assessment, and prognostic nutritional index in assessing malnutrition and predicting clinical outcome in cirrhotic outpatients. Nutrition 2005; 21:113–117. [DOI] [PubMed] [Google Scholar]
- 31.Guglielmi FW, Panella C, Buda A, et al. Nutritional state and energy balance in cirrhotic patients with or without hypermetabolism. Multicentre prospective study by the ‘Nutritional Problems in Gastroenterology’ Section of the Italian Society of Gastroenterology (SIGE). Dig Liver Dis 2005; 37:681–688. [DOI] [PubMed] [Google Scholar]
- 32.Moctezuma-Velázquez C, García-Juárez I, Soto-Solís R, et al. Nutritional assessment and treatment of patients with liver cirrhosis. Nutrition 2013; 29:1279–1285. [DOI] [PubMed] [Google Scholar]
- 33.Tsochatzis EA, Bosch J, Burroughs AK. Liver cirrhosis. Lancet 2014; 383:1749–1761. [DOI] [PubMed] [Google Scholar]
- 34.Periyalwar P, Dasarathy S. Malnutrition in cirrhosis: contribution and consequences of sarcopenia on metabolic and clinical responses. Clin Liver Dis 2012; 16:95–131. [DOI] [PMC free article] [PubMed] [Google Scholar]
- 35.Changani KK, Jalan R, Cox IJ, et al. Evidence for altered hepatic gluconeogenesis in patients with cirrhosis using in vivo 31-phosphorus magnetic resonance spectroscopy. Gut 2001; 49:557–564. [DOI] [PMC free article] [PubMed] [Google Scholar]
- 36.Schneeweiss B, Graninger W, Ferenci P, et al. Energy metabolism in patients with acute and chronic liver disease. Hepatology 1990; 11:387–393. [DOI] [PubMed] [Google Scholar]
- 37.Numasawa Y, Kohsaka S, Miyata H, et al. Impact of body mass index on in-hospital complications in patients undergoing percutaneous coronary intervention in a Japanese real-world multicenter registry. PLoS One 2015; 10:e0124399. [DOI] [PMC free article] [PubMed] [Google Scholar]
- 38.Grundy SM, Brewer HB, Jr, Cleeman JI, et al. Definition of metabolic syndrome: report of the National Heart, Lung, and Blood Institute/American Heart Association conference on scientific issues related to definition. Arterioscler Thromb Vasc Biol 2004; 24:e13–e18. [DOI] [PubMed] [Google Scholar]
- 39.Levine ME, Crimmins EM. The impact of insulin resistance and inflammation on the association between sarcopenic obesity and physical functioning. Obesity (Silver Spring) 2012; 20:2101–2106. [DOI] [PMC free article] [PubMed] [Google Scholar]
- 40.Hong HC, Hwang SY, Choi HY, et al. Relationship between sarcopenia and nonalcoholic fatty liver disease: the Korean Sarcopenic Obesity Study. Hepatology 2014; 59:1772–1778. [DOI] [PubMed] [Google Scholar]


