FIGURE 2.

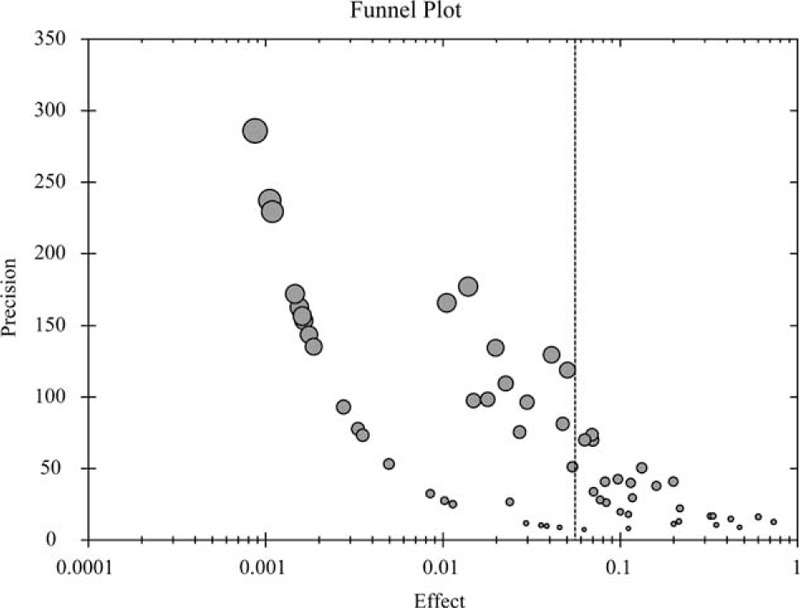
Funnel plot for the meta-analysis of the total drug types. The circles corresponding to the included trials were symmetrically distributes.

Funnel plot for the meta-analysis of the total drug types. The circles corresponding to the included trials were symmetrically distributes.