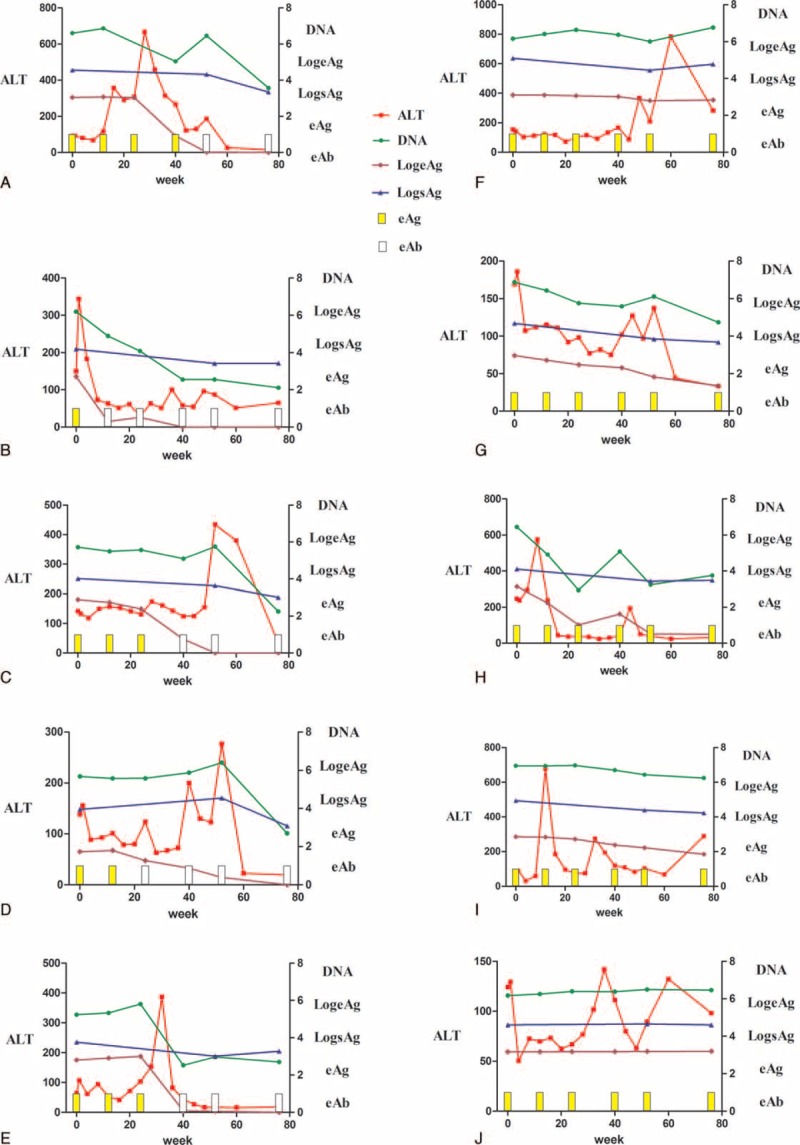
FIGURE 1.

Comparison of clinical and virological data from individual CHB patients receiving YIC treatment over the study period. The levels of ALT, HBV DNA, HBsAg, HBeAg, and HBeAb were compared between responders and nonresponders groups. Data of 5 patients in the responders group are listed on the left (A–E, patient IDs: 2, 29, 85, 87, 307, respectively), and data of 5 patients in the nonresponders group are listed on the right (F–J, patient IDs: 19, 24, 44, 58, 88, respectively). The levels of HBeAg, DNA, and HBsAg were log10 transformed. The yellow bars represent HBeAg positivity, while the white bars represent HBeAg negativity. ALT = alanine aminotransferase, CHB = chronic hepatitis B, HBeAb = Hepatitis Be antibody, HBeAg = hepatitis Be antigen, HBsAg = hepatitis B surface antigen, HBV DNA = hepatitis B virus deoxyribonucleic acid, YIC = antigen-antibody immunogenic complex based therapeutic vaccine.
