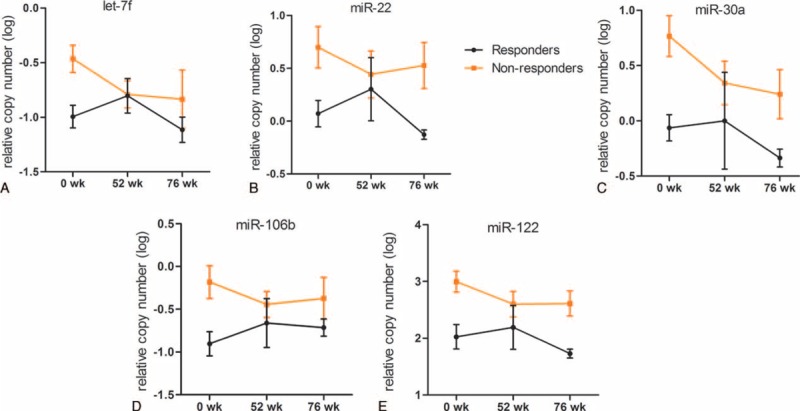
FIGURE 2.

Differences in levels of miRNAs in sera of the responsive and nonresponsive patients at different time points. Kinetic changes of serum let-7f (A); miR-22 (B); miR-30a (C); miR-106b (D); miR-122 (E) in the responders and nonresponders groups during the study period. The relative levels of miRNAs were log10 transformed. Data were presented as means ± SD. miRNA = microRNA, SD = standard deviation.
