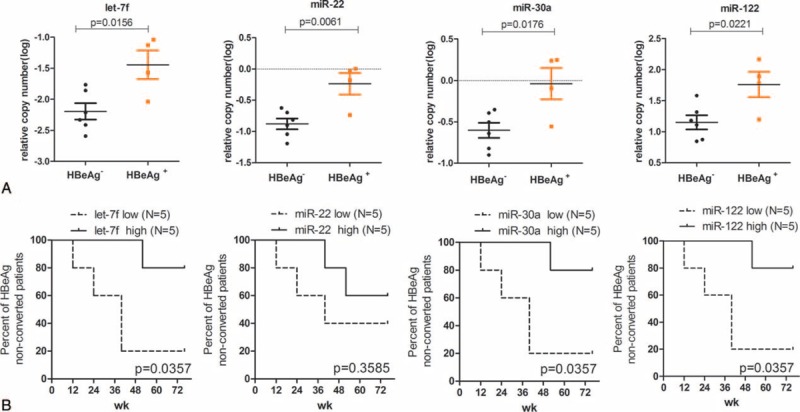
FIGURE 4.

Relationships between baseline levels of HBsAg-carried miRNA and HBeAg clearance or HBeAg seroconversion. Relationships between baseline levels of 4 HBsAg-carried miRNAs and HBeAg clearance (A). Patients were separated into 2 groups based on the HBeAg clearance at week 76. The statistical differences of miRNAs levels between the HBeAg negative (N = 5) and HBeAg positive (N = 5) groups were analyzed by 1-way ANOVA. Kaplan–Meier curves based on differentially expressed 4 HBsAg-carried miRNAs (B). Based on the median value of baseline miRNA levels, patients were divided into 2 groups, expression levels high group (above the median value) and expression levels low group (below the median value), and Kaplan–Meier curves were used to evaluate the relationships of HBeAg seroconversion between the miRNA expression levels high and low groups. Lower baseline miRNA levels inversely correlated with HBeAg seroconversion. ANOVA = analysis of variance, HBeAg = hepatitis Be antigen, HBsAg = hepatitis B surface antigen, miRNA = microRNA.
