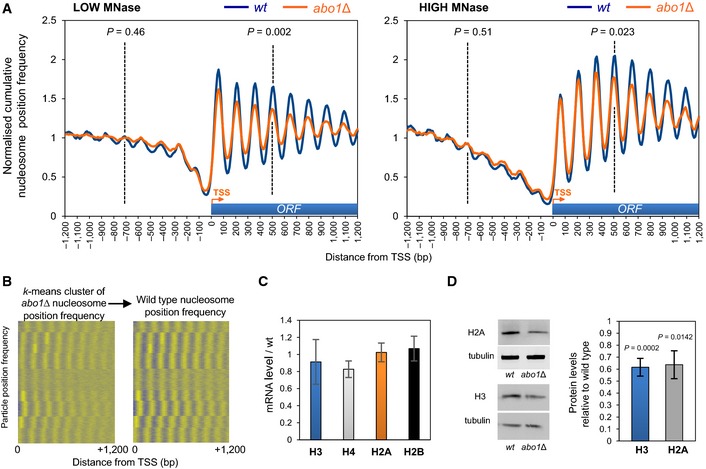
Figure 2. Deletion of abo1 + results in the perturbation of nucleosomal organisation at coding sequences.

- Normalised cumulative nucleosome (150 ± 30 bp size class) position frequency profiles for 4,013 Schizosaccharomyces pombe genes aligned at the transcription start site (TSS) plotted from low MNase (biorep1) and high MNase (biorep2) data sets. P‐values (calculated using a two‐tailed unpaired t‐test) for the difference in means between random n = 100 subsets of the frequency values at the points indicated by the dotted lines (“−4” nucleosome and “+4” nucleosome) are shown.
- Nucleosome position frequency values for the coding regions of 4,013 Schizosaccharomyces pombe genes were k‐means clustered (k = 9) using the abo1∆ data from biorep1 (low MNase) and displayed with positive values coloured yellow and other values coloured blue (left‐hand panel). The cluster order was then used to display the equivalent wild‐type frequency values in the right‐hand panel.
- Level of histone gene mRNAs was determined by qRT–PCR. Data are the mean of four independent biological repeats, and error bars are ± SEM. Two‐tailed unpaired t‐tests showed no significant differences (P > 0.05) between wild‐type and abo1Δ cells.
- Whole‐cell extracts were subjected to Western blotting with histone H3 (Abcam), histone H2A (Abcam) and tubulin antibodies. Examples of the primary data are shown (left) along with a quantification of histone H2A and H3 levels normalised to tubulin (right). Data are the mean of at least three independent repeats, and error bars represent ± SEM. P‐values were calculated using a two‐tailed unpaired t‐test.
Source data are available online for this figure.
