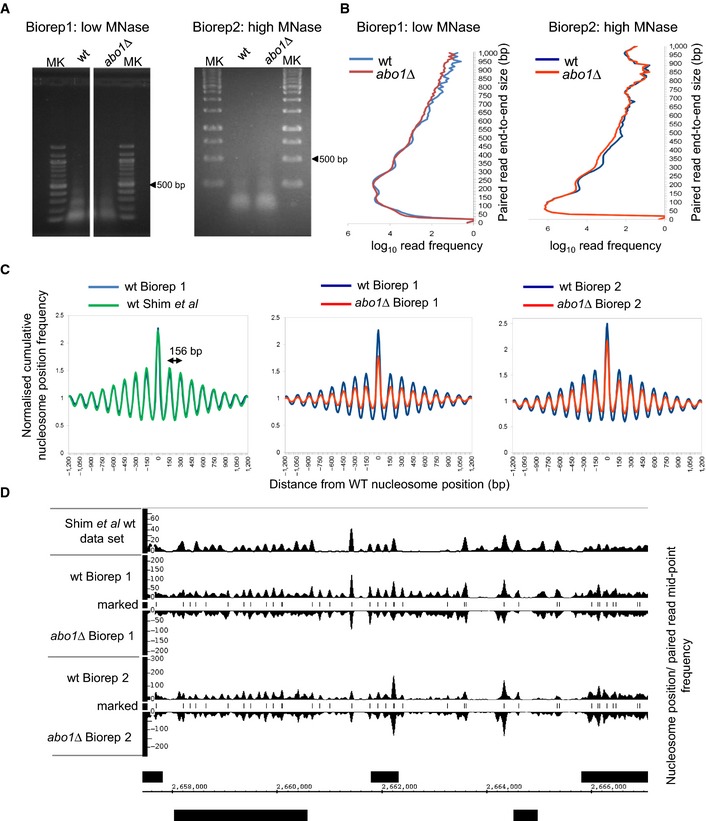
Nucleosome positions in wild‐type (Biorep1) cells were defined as the locations of 150 ± 30 bp (nucleosome) size class particle frequency peak summits (frequency value > 25). This simple heuristic procedure identifies 60,658 putative positioned nucleosomes in the
S. pombe genome. The nucleosome size class particle frequency distributions centred on and surrounding (± 1,200 bp) these positions were then smoothed using an Epanechnikov kernel density estimate (to match that of a previously published data set (Gene Expression Omnibus
GSE40451 30), summed and normalised to the average frequency value occurring in the ± 1,200 bp window, for each of the data sets. These cumulative distributions reveal the average nucleosome organisation surrounding positioned nucleosomes in the genome of each cell type. Three pair‐wise comparisons are shown. The nucleosome distribution from wild‐type Biorep1 overlaps with that in a previously published wild‐type data set (Gene Expression Omnibus
GSE40451 30), confirming that our nucleosome mapping method yields similar results to those obtained using other technology. The
abo1∆ mutant nucleosome distributions observed in Bioreps 1 and 2 both show a lower peak height and higher trough depth than the corresponding wild‐type. The wavelength of the peak pattern is shown and is equal to the known
S. pombe nucleosome repeat length.

