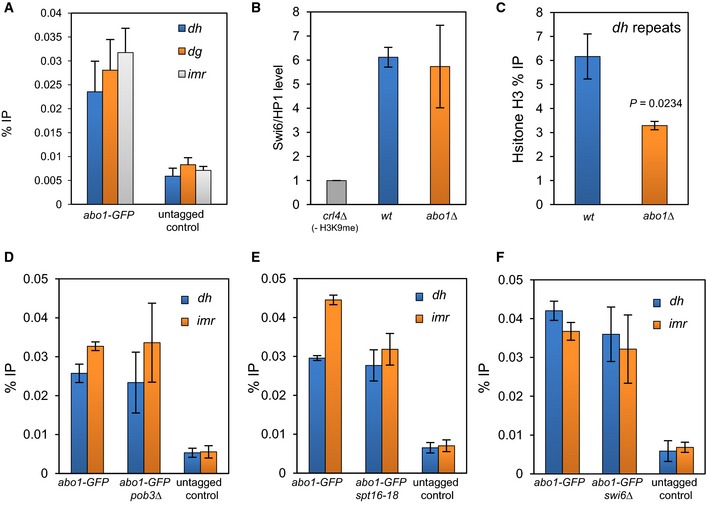
ChIP analysis was performed on wild‐type (untagged) and abo1‐GFP cells and the resulting DNA analysed by qPCR for centromeric (dh, dg and imr) repeat sequences. Data are the mean of four independent biological repeats, and error bars represent ± SEM. P‐values calculated using a two‐tailed unpaired t‐test indicate that all loci are significantly enriched (P < 0.05) relative to the untagged control.
The indicated strains expressing GFP‐Swi6 were subjected to ChIP analysis. The level of centromeric (dg) repeat sequences relative to the euchromatic control locus, adh1
+, was determined by qPCR and scaled to a clr4Δ (‐H3 K9me control) mutant. Data are the mean of two independent ChIP experiments, and error bars represent the range of the data.
Histone H3 levels at centromeric (dh) repeat sequences were determined by ChIP–qPCR. Data are the mean of three independent ChIP experiments, and error bars are ± SEM. P‐values were calculated using a two‐tailed unpaired t‐test.
ChIP analysis of Abo1‐GFP at centromeric (dh and imr) repeat sequences regions in wild‐type and pob3Δ cells. Data are the mean of three independent experiments, and error bars represent ± SEM. P‐values, calculated using a two‐tailed unpaired t‐test, indicated no significant difference (P > 0.05) for wild‐type and pob3Δ cells.
ChIP analysis of Abo1‐GFP at centromeric (dh and imr) repeat sequences in wild‐type and pob3Δ cells. Data are the mean of duplicate experiments, and error bars represent the range of the data.
ChIP analysis of Abo1‐GFP over the dh and imr regions in wild‐type and swi6Δ cells. Data are the mean of three independent experiments, and error bars represent ± SEM. P‐values, calculated using a two‐tailed unpaired t‐test, indicated no significant differences (P > 0.05) for wild‐type and swi6Δ cells.

