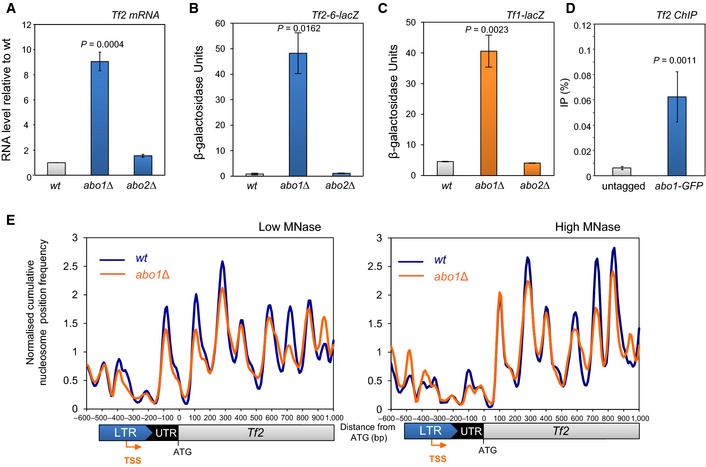
Figure 6. Abo1 represses LTR retrotransposons.

-
ARNA was extracted from mid log‐phase cells, and Tf2 mRNA levels were determined by qRT–PCR, normalised to act1 + mRNA and scaled relative to the wild‐type level. Data are the mean of three independent biological repeats, and error bars represent ± SEM.
-
B, CMid log‐phase cells with the indicated integrated lacZ reporter were subjected to quantitative β‐galactosidase assays. Data are the mean of three independent biological repeats, and error bars represent ± SEM.
-
DChIP DNA samples from wild‐type (untagged) and abo1‐GFP cells were analysed by qPCR for Tf2 LTR. Data are the mean of four independent biological repeats, and error bars represent ± SEM.
-
ENormalised cumulative nucleosome (150 ± 30 bp) position frequency profiles for Tf2 LTR retrotransposons aligned at the ATG plotted from low MNase (biorep1) and high MNase (biorep2) data sets.
