-
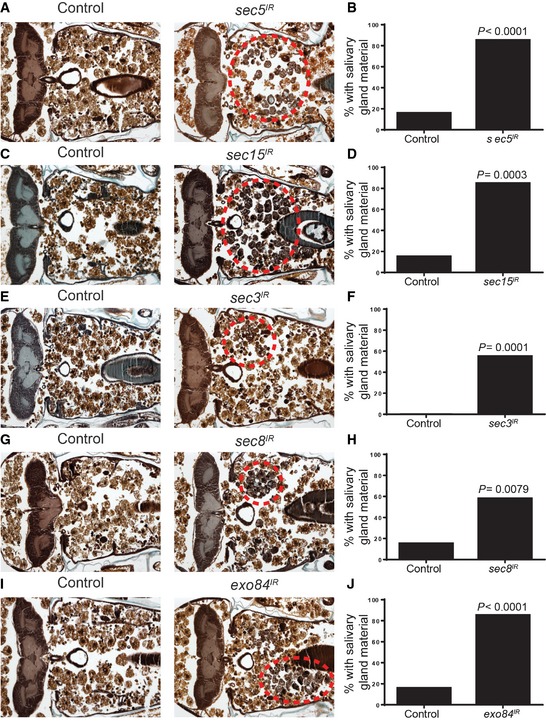
A, B
Control animals (+/w; UAS‐sec5
IR/+, n = 19) and those with salivary gland‐specific knockdown of sec5 (fkh‐GAL4/w; UAS‐sec5
IR/+, n = 20) were analyzed by histology for the presence of salivary gland material (red dotted circle) 24 h after puparium formation. Quantification of the data is shown in (B).
-
C, D
Control animals (+/w; UAS‐sec15
IR/+, n = 20) and those with salivary gland‐specific expression sec15 (fkh‐GAL4/w; UAS‐sec15
IR/+, n = 20) were analyzed by histology for the presence of salivary gland material (red dotted circle) 24 h after puparium formation. Quantification of the data is shown in (D).
-
E, F
Control animals (+/w; UAS‐sec3
IR/+, n = 20) and those with salivary gland‐specific expression sec3 (fkh‐GAL4/w; UAS‐sec3
IR/+, n = 20) were analyzed by histology for the presence of salivary gland material (red dotted circle) 24 h after puparium formation. Quantification of the data is shown in (F).
-
G, H
Control animals (+/w; UAS‐sec8
IR/+, n = 20) and those with salivary gland‐specific knockdown of sec8 (fkh‐GAL4/w; UAS‐sec8
IR/+, n = 19) were analyzed by histology for the presence of salivary gland material (red dotted circle) 24 h after puparium formation. Quantification of the data is shown in (H).
-
I, J
Control animals (+/w; UAS‐exo84
IR/+, n = 19) and those with salivary gland‐specific knockdown of exo84 (fkh‐GAL4/w; UAS‐exo84
IR/+, n = 20) were analyzed by histology for the presence of salivary gland material (red dotted circle) 24 h after puparium formation. Quantification of the data is shown in (J).
Data information: Data are represented as means. Statistical significance was determined using a chi‐square test.