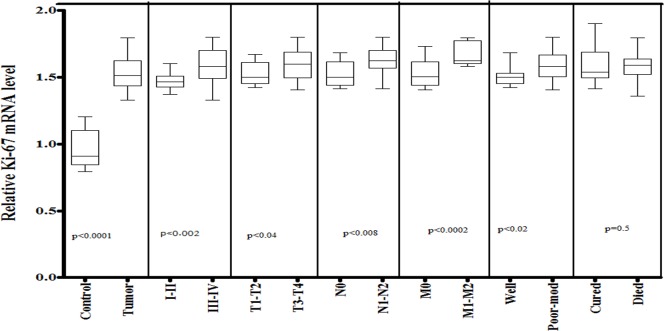
Fig 6. mRNA expression of Ki-67 in HNSCC cases of study cohort.
Box plot comparing the Ki-67 mRNA levels of HNSCC and normal control samples, HNSCC samples with clinical stage I–II and clinical stage III–IV, with different T stages, with lymph node (N1–N2) and without lymph node (N0), with metastasis (M1-M2) and without metastasis (M0), with survival status and HNSCC samples with different grades. The p-values were computed using one-way analysis of variance and Tukey s’ post hoc test.

