-
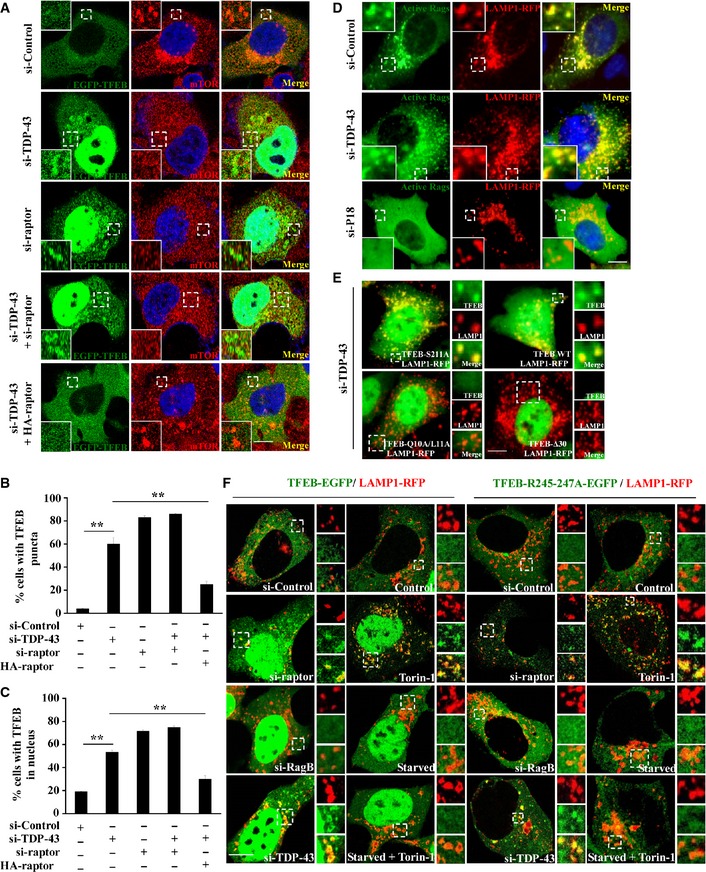
A–C
HeLa cells were transfected with the indicated siRNAs. After 48 h, the cells were transfected with TFEB‐EGFP (green) for 24 h. The cells were stained with anti‐mTOR (red) antibody and DAPI (blue) and then visualized using confocal microscopy. Regions within the dotted boxes are magnified in the insets. Scale bar, 5 μm. The quantification data of TFEB puncta and nuclear localization are shown in (B and C), respectively. Data from three independent experiments represented as means ± S.E.M.; **, P < 0.01; one‐way ANOVA.
-
D
HEK 293 cells were transfected with the indicated siRNAs. After 48 h, the cells were re‐transfected with LAMP1‐RFP (red) and constitutively active HA‐GST‐tagged Rag GTPase mutants (RagA Q66L + RagC S75L = RagAGTP + RagCGDP) for 24 h. The cells were stained with anti‐HA (green) antibody and DAPI (blue). Cells were visualized using microscope IX71. Regions within the dotted boxes are magnified in the insets. Scale bar, 5 μm.
-
E
HEK 293 cells were transfected with siRNA targeting TDP‐43. After 48 h, the cells were re‐transfected with EGFP‐tagged TFEB‐WT, TFEB‐S211A, TFEB‐Q10A/L11A, or TFEB‐Δ30, along with LAMP1‐RFP for 24 h. Cells were visualized using microscope IX71. Regions within the dotted boxes are magnified in the insets. Scale bar, 5 μm.
-
F
HEK 293 cells were transfected with the indicated siRNAs. After 48 h, the cells were re‐transfected with EGFP‐tagged TFEB‐WT or TFEB‐R245‐247A, along with LAMP1‐RFP for 24 h. Then, the cells were incubated with Torin‐1 (250 nM) for 1 h, Earle's balanced salt solution (starvation) for 2 h or incubated with both. Cells were fixed and visualized using confocal microscopy. Regions within the dotted boxes are magnified in the insets. Scale bar, 5 μm.