
Figure 5. TDP‐43 regulates global gene expression levels in ALP through TFEB .
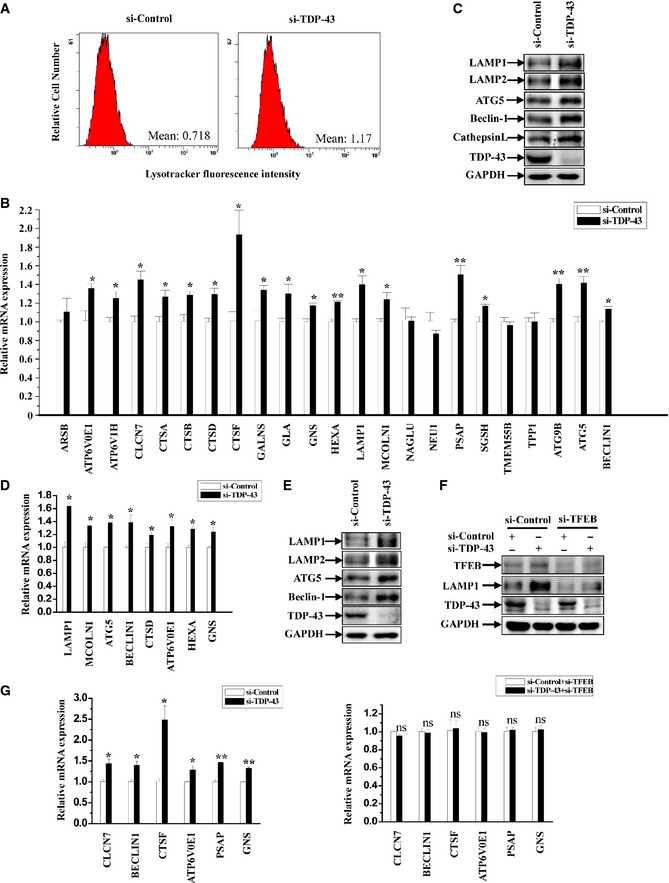
- HeLa cells were transfected with the indicated siRNAs. After 72 h, the cells were stained with Lysotracker (red). Then, the cells were harvested and processed for flow cytometry analysis.
- Similar transfection as in (A) was performed, and transfected cells were processed for qRT–PCR analysis. The mRNA levels of lysosomal and autophagic genes were quantified and normalized relative to GAPDH. The data from three independent experiments are presented as means ± S.E.M.; *, P < 0.05; **, P < 0.01; one‐way ANOVA.
- HeLa cells were similarly transfected as in (A), and the cell lysates were subjected to immunoblot analysis using anti‐TDP‐43, ‐LAMP1, ‐LAMP2, ‐ATG5, ‐Beclin‐1, ‐cathepsin L, and ‐GAPDH antibodies.
- SH‐SY5Y cells were similarly transfected as in (A) and processed as in (B). Data from three independent experiments represented as means ± S.E.M.; *, P < 0.05; one‐way ANOVA.
- Similar experiments as in (C) were performed in SH‐SY5Y cells.
- HeLa cells were transfected with the indicated siRNAs. Cell lysates were subjected to immunoblot analysis using anti‐TDP‐43, ‐TFEB, ‐LAMP1, and ‐GAPDH antibodies.
- Similar transfection as in (F) was performed, and transfected cells were processed for qRT–PCR analysis as in (B). The data from three independent experiments are presented as means ± S.E.M.; ns, not significantly different; *, P < 0.05; **, P < 0.01; one‐way ANOVA.
Source data are available online for this figure.