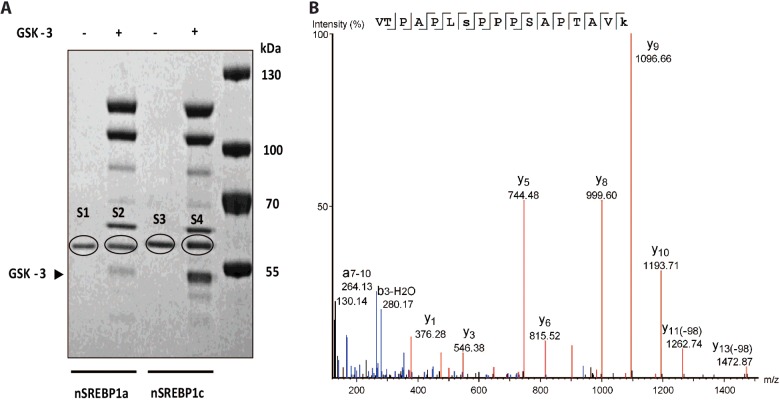
Figure 7. GSK-3 phosphorylates nSREBP-1c and nSREBP-1a proteins in vitro.
(A) The recombinant nSREBP-1a or nSREBP-1c proteins purified from E. coli were incubated with or without GSK-3β, size-fractionated by SDS-PAGE and stained with SimplyBlue. Lanes 1 and 3 show recombinant SREBP-1a and SREBP-1c in the absence of GSK-3, whereas lanes 2 and 4 show corresponding proteins incubated with GSK-3β. Bands marked S1, S2, S3 and S4 were cut out for MS analysis. Molecular markers are shown in the extreme right lane. (B) Mass spectrum demonstrating that SREBP-1c is phosphorylated at Ser73 and nSREBP-1a at Ser97. Raw data from LC–MS/MS analysis of SREBP-1c LysC/tryptic peptides was imported into PEAKS 7 and searched against the RefSeq2015 Rattus protein database confirming the PD1.4/Mascot search results for Ser73 phosphorylation of VTPAPLSPPPSAPTAVK. The spectrum has been deisotoped, converting the multi-charged ions to singly charged ions, and annotated in PEAKS. Ion y10 shows that the phosphorylation is NOT at S77 or T80. The y11-98 ion indicates that this ion has lost a phosphate and water that is diagnostic for a phosphorylation site. The b3-H2O shows that the phosphorylation is NOT at the T68. The ion at 264 which could be interpreted as phosphorylation on the T68, however this ion also matches the more likely internal a7-10 fragment ion which often occurs in proline-containing peptides. Lower case ‘s’ is Ser plus phosphate (+79.97), lower case ‘k’ is Lys plus TMT 6-plex tag (+229.16).

