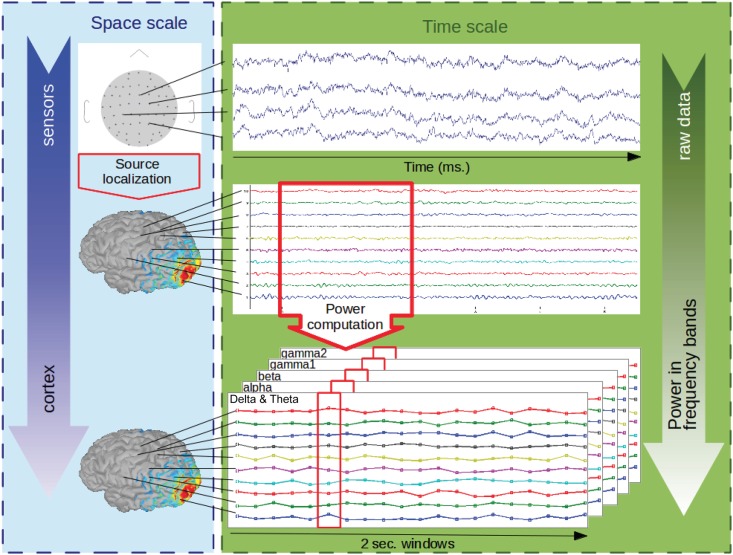
Fig 1. Processing of the EEG data.
The artefact-free raw data at the sensors level (top row) were fed into a minimum-norm localisation algorithm to obtain current densities at the cortex level (middle row). After filtering in 5 frequency bands (Delta & Theta, Alpha, Beta, Gamma1, Gamma2), the power of the cortical signals was computed by integrating over two-second-long windows. The end result at the cortical level was the power time courses in each of the 5 frequency bands (bottom row).

