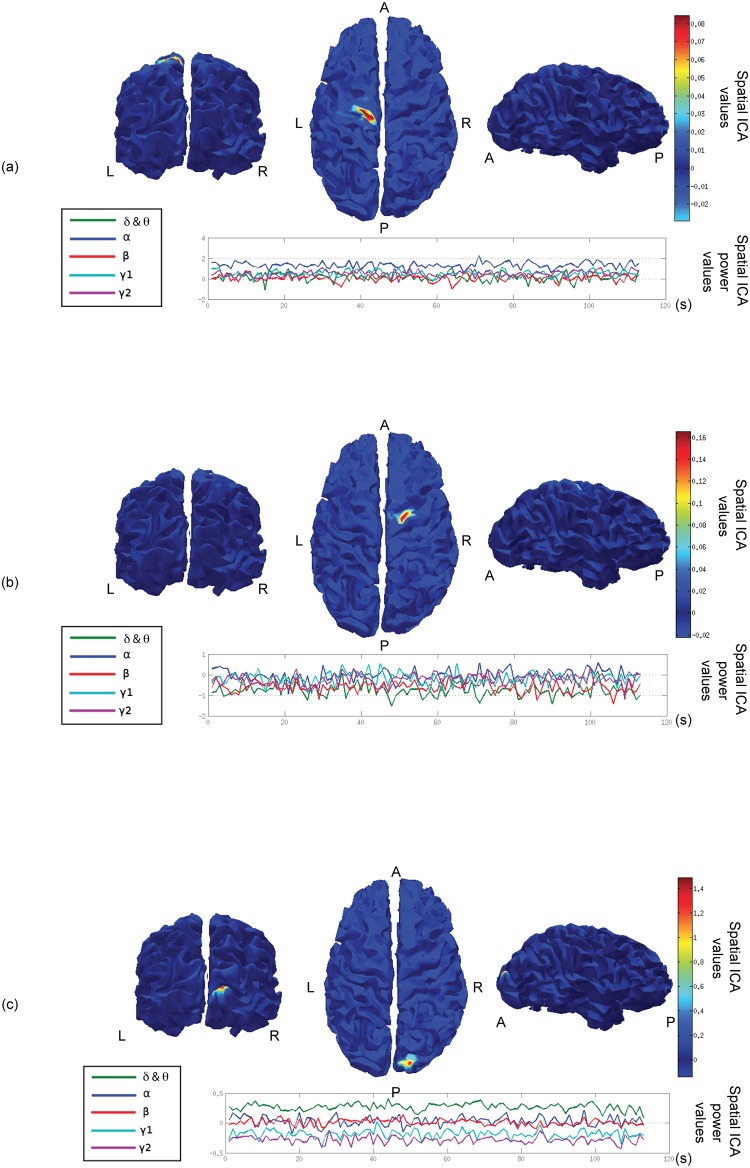
Fig 3. Three individual spatial ICA components.
For each component, the top part of the figure shows the values of the spatial distribution. The bottom part of the figure shows the power values of the corresponding component along time for the 5 frequency bands Delta & Theta, Alpha, Beta, Gamma1 and Gamma2.

