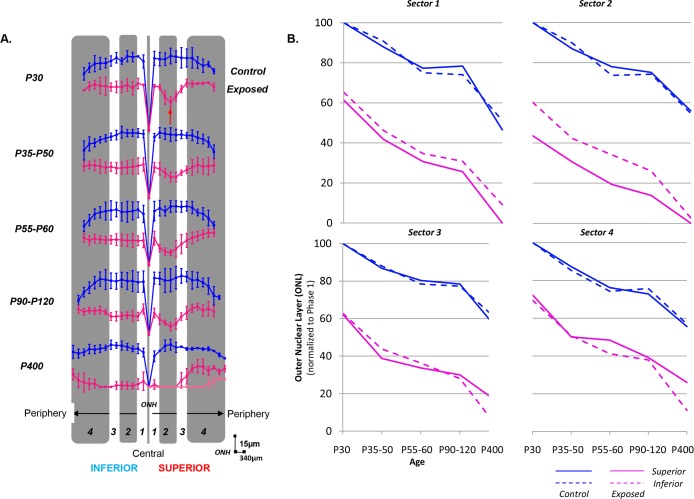
Fig 2.
(A) Hemiretinal measurements of ONL loss along the supero-inferior axis in control (blue) and light (pink) exposed rats shown in spidergraph form for different age groups (from P30 to P400). Values were taken at every 340μm from the optic nerve head towards the ora serrata in both the inferior (left) and superior (right) hemiretinas. The red arrow points at the region of maximal damage (i.e. retinal hole). Abbreviations: optic nerve head (ONH). Calibration bars: vertical (15μm) and horizontal (340μm). (B) Regional variations in the ONL rate loss. ONL values are regrouped in four different sectors based on the degree of the retinopathy: Sector 1 [from the ONH to 680μm], Sector 2 [680μm-1700μm], Sector 3 [1700μm-3060μm] and Sector 4 [3060μm to 4760μm (ora serrata)] and analysed for each age group in both control (blue) and light (pink) exposed animals for the superior (solid line) and inferior (dashed line) hemiretinas.

