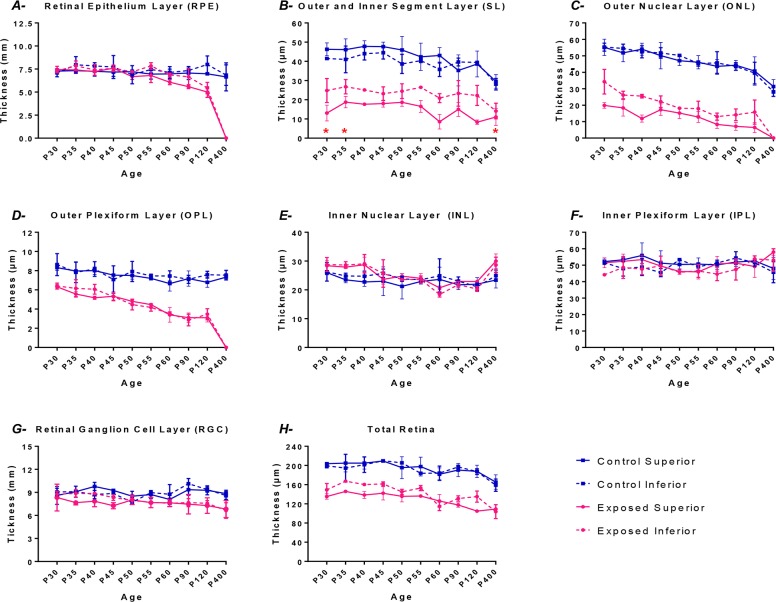
Fig 3. Graphic representation of the thickness (taken at 1000μm from the optic nerve head) of different retinal layers: RPE (A); SL (B); ONL (C); OPL (D); INL (E); IPL (F); RGC (G) and total retina (H) for the control (blue lines) and the light exposed (pink lines) groups in both the superior (solid lines) and the inferior retina (dashed lines).
Measurements were obtained at different experimental postnatal periods (from P30 to P400). Results are given as the mean thickness (μm) ± 1SD. Asterisks: Between P30-P35 and at P400, the values reported are those of the thickness of the subretinal space as the length of the outer and inner segments could not be quantifiable (only debris occupied the subretinal space during this period).

