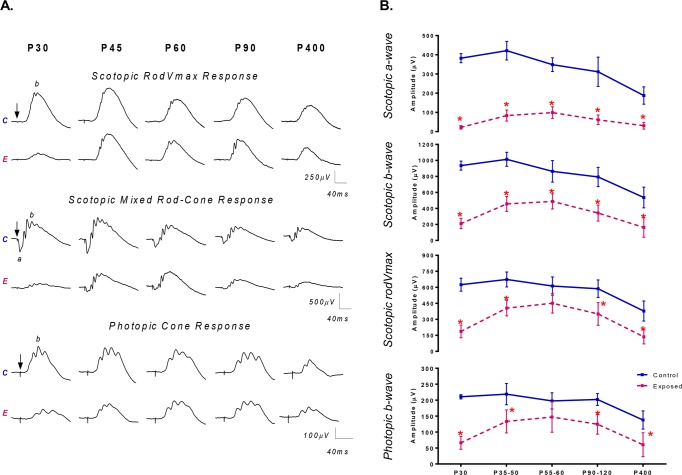
Fig 4.
(A) Representative scotopic rodVmax and mixed rod-cone ERG responses and photopic cone ERG responses recorded from both the control (unexposed) and the light exposed animals (P14-28; 10 000lux) at selected experimental time points (from P30 to P400). Horizontal calibration: 40ms; Vertical calibration: 250μV (rodVmax); 500μV (mixed rod-cone); 100μV (cone). A 20ms prestimulus baseline is included in all tracings. Vertical arrows indicate the flash onset. Abbreviations: Control (C); Exposed (E); a-wave (a) and b-wave (b). (B) Graphic representation of the global retinal function (fERG) recorded from different age groups (P30, P35-50, P55-60, P90-120 and P400 groups) of retinal development of normal (control; blue lines) and LIR (exposed; pink lines) rats for the (A) scotopic a-wave; (B) scotopic b-wave; (C) scotopic rodVmax; (D) photopic b-wave. Asterisks represent statistically significant differences (p < .05) compared to control groups. Results are reported as mean 1±SD.

