Fig 6.
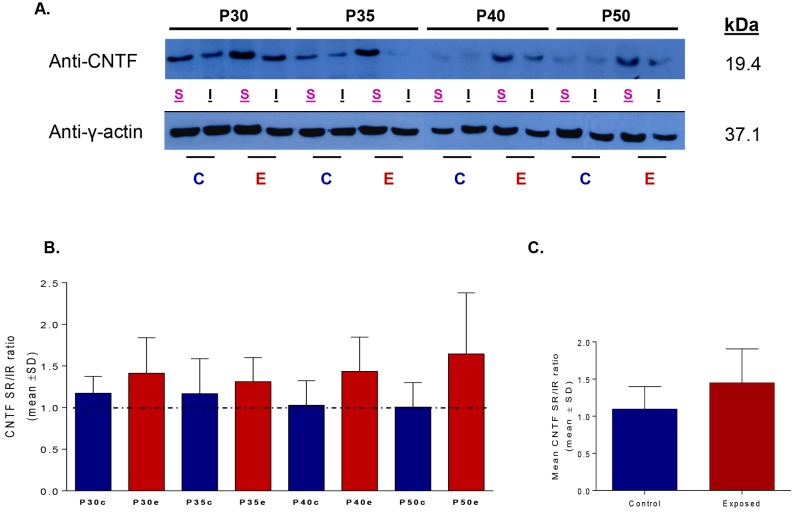
(A) Variations in the expression of the CNTF protein levels in control and light exposed groups collected in the superior and the inferior retinas at selected postnatal days (P30, P35, P40 and P50). CNTF levels were quantified by normalizing its expression with that of the y-actin in each hemiretina. (B) A superior/inferior ratio was then calculated in the control (blue) and light exposed (red) groups to compare CNTF in both hemiretinas. (C) Statistical significance was only obtained when all the control against all the exposed ratios were averaged (1±SD) together (Student’s t-test, p<0.03). Abbreviations: C: control; E: exposed; S: superior; I: inferior. Right: molecular mass (kDa) of CNTF and y-actin.

