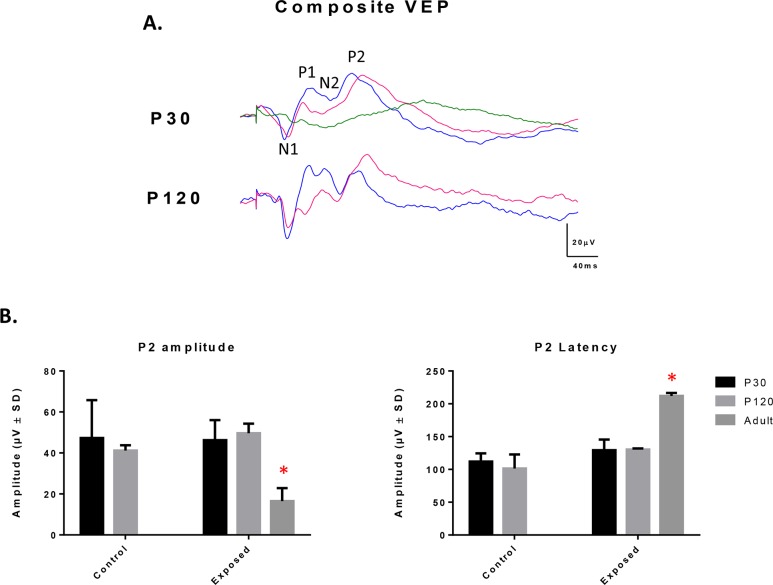
Fig 7.
(A) Composite VEP recordings obtained from control (blue) and juvenile light exposed rats (pink) at P30 and P120 and from adult light exposed rats (green) immediately after an exposure of 6 consecutive days (from P60-P66). Vertical calibration bar: 20μV and Horizontal calibration bar: 40ms. Abbreviations: N (negative) and P (positive) components of the VEP. (B) Graphic representation of the amplitude (μV) and peak time (ms) of P2, the most prominent component of the VEP response. Asterisks represent statistically significant differences (p < .05) compared to control groups. Results are reported as mean 1±SD.

