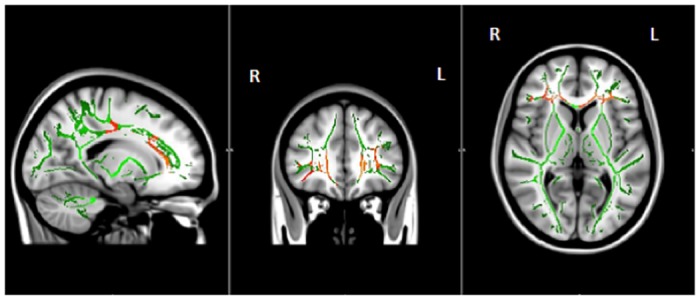
Fig 2. White matter areas with significantly decreased fractional anisotropy (FA) in PD (n = 40) versus non-PD peers (n = 40) corrected with threshold free cluster enhancement.

Areas with significantly decreased FA are shown in colors ranging from red to yellow (p < 0.05, corrected for multiple comparisons). Voxelwise group comparisons of FA were carried out using TBSS (Tract-Based Spatial Statistics, part of FSL). TBSS projects all participants’ FA data onto a mean FA tract skeleton (shown in green), before applying voxelwise cross-subject statistics. MRI conducted within 24 hours of cognitive testing. R = Right; L = Left.
