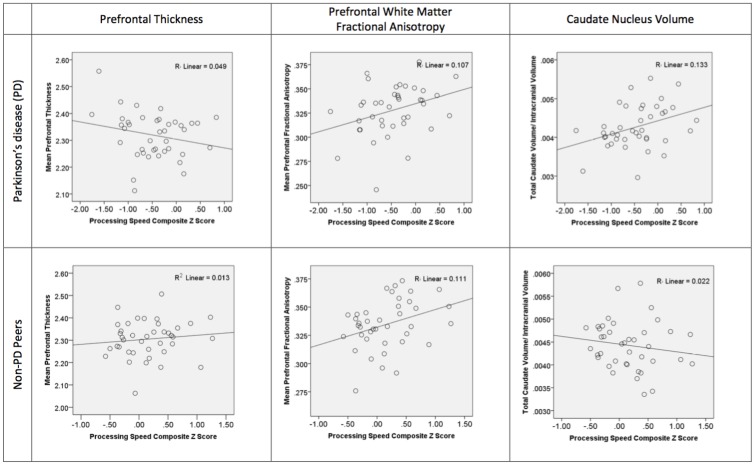
Fig 3. Scatter graphs showing group processing speed composite scores plotted against prefrontal gray thickness, prefrontal white matter fractional anisotropy, and caudate nucleus volume.
The top row shows scatter graphs for the individuals with PD (n = 40). The second row presents the non-PD peers (n = 40). The processing speed composite is based on the average of subtest standardized z-scores derived from published normative references. Note: The referenced r value is r squared.

