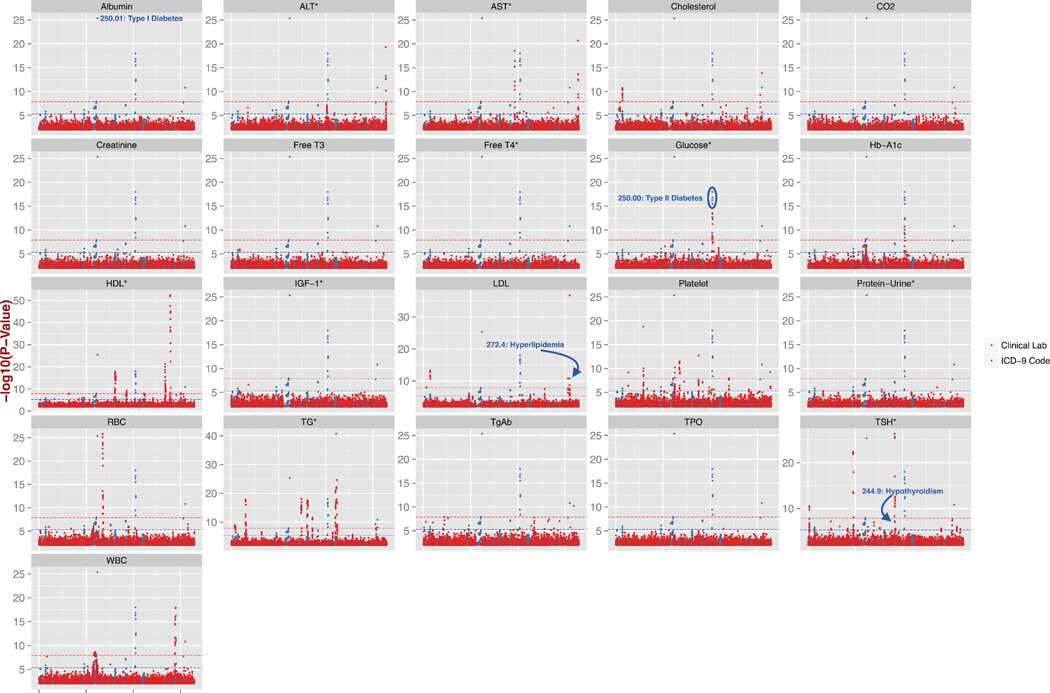
Figure 1.
Manhattan plots of all 21 GWAS for clinical lab measures and the results of the following ICD-9 based PheWAS. For each of 21 clinical lab measures, the results of associations are marked as −log(10) of the p-value in red, with the abbreviation of each clinical lab measure indicated above each plot, abbreviations explained in Table 1. Plotted in blue are −log10 (p-value) from the associations of distinct ICD-9 code based case/control diagnoses. All results are from p-values < 0.01. The red dashed line in each Manhattan plot is at the Bonferroni corrected p-value of 1.37 × 10⁻⁸ for the clinical lab GWAS, and the blue dashed line is the Bonferroni corrected p-value 4.9 × 10⁻⁶ for the ICD-9 diagnoses based PheWAS.

