
Figure 1. Sgo1, Aurora B, and PP2A-B56 Colocalize at Centromeres of Unattached Chromosomes.
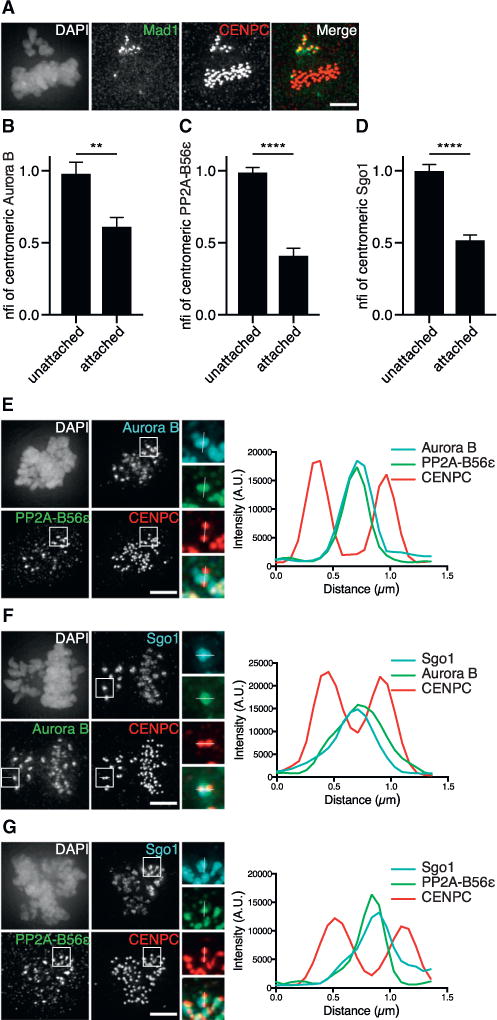
(A) IF of Mad1 and CENPC in RPE-1 cells, treated with a low dose (0.069 μM) of nocodazole for 14 hr to increase the frequency of cells with both bi-oriented (Mad1−) and unattached (Mad1+) chromosomes.
(B–D) Quantifications of centromeric fluorescence intensities (CFIs) of Aurora B, PP2A-B56ɛ, and Sgo1 on attached and unattached chromosomes of RPE-1 cells treated as in (A). CFIs were normalized for the unattached centromeres (nfi). Error bars are SEM between cells from two independent experiments (10–15 cells/experiment).
(E–G) IF of Aurora B and PP2A-B56ɛ, Sgo1 and Aurora B, or Sgo1 and PP2AB56ɛ of cells treated as in (A). Insets show kinetochore pairs of the boxed regions used for line plot analysis. nfi, normalized fluorescence intensity; A.U., arbitrary units. The scale bars represent 5 μm; **p < 0.01; ****p < 0.0001 (unpaired t test). See also Figure S1.