
Figure 3. Excessive Centromeric PP2A-B56 Recruitment by Sgo1 Impairs Aurora B Function.
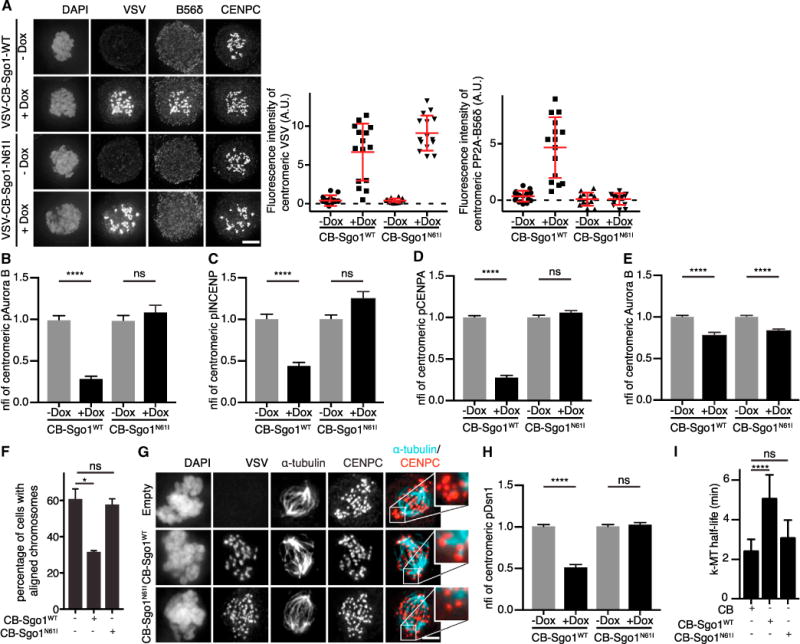
(A) IF and quantifications of PP2A-B56δ and VSV of RPE-1 cells stably expressing inducible VSV-CB-Sgo1WT or VSV-CB-Sgo1N61I, treated with 0.83 μM nocodazole and doxycycline where indicated. Absolute CFIs were measured. One representative experiment out of three is shown. Each dot represents a single cell (n = 15 cells). Error bars represent SD.
(B–E) Quantifications of pAurora B, pINCENP, pCENPA, and Aurora B of cells treated as in (A). Error bars represent the SEM between cells from independent experiments (n = 2 for pAuroraB and pINCENP; n = 3 for pCENPA and Aurora B; 15–30 cells/experiment).
(F) RPE-1 cells or RPE-1 cells expressing VSV-CB-Sgo1WT or VSV-CB-Sgo1N61I were released from a monastrol block into MG132 and fixed 60 min later. Percentage of cells with all chromosomes correctly aligned in metaphase was determined (n > 200 cells; two independent experiments). Error bars represent SD.
(G) IF of VSV, α-tubulin, and CENPC of cells treated as in (F) and subjected to cold-induced microtubule depolymerization. Insets are enlargements of boxed regions.
(H) Quantification of pDsn1 of cells treated as in (B)–(E). Error bars are SEM between cells from two independent experiments (15 cells/experiment).
(I) k-MT half-life calculated from the exponential decay curve (Figure S3P) of photoactivated fluorescence of GFP-tubulin (r2 > 0.99) in U2OS cells transiently transfected with the indicated plasmids (n ≥ 10 cells). Error bars represent SD. The scale bars represent 5 μm; ****p < 0.0001; *p < 0.05; ns, not significant (unpaired t test). See also Figures S2 and S3.