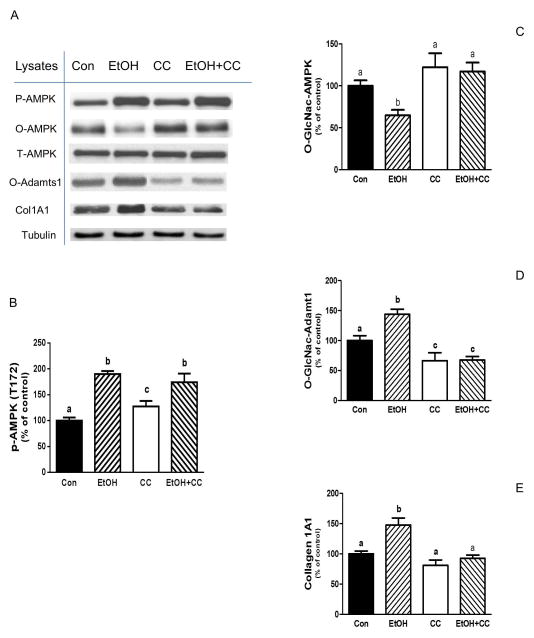
Fig. 6. EtOH increases collagen I and O-GlcNAc-Adamts1 levels via an AMPK dependent pathway.
C2C12 myocytes were incubated with EtOH as described in Fig.1. Cells were pre-incubated for 1 h in the presence or absence of the AMPK inhibitor compound C (CC, 20 μM). Thereafter, EtOH was added to SFM for an additional 50 min in the presence or absence of inhibitor. Cells were collected and analyzed via Western blotting using antibodies against the indicated proteins (panel A). The protein levels were quantified and presented as a bar graph (panel B-E). Results were normalized to total cell protein and expressed as a percentage of control values. Each bar graph represents a mean ± SE of 4 independent experiments consisting of 4 replicate samples per experiment. Groups with different letters are significantly different from one another (P< 0.05). Groups with the same letters are not significantly different.

