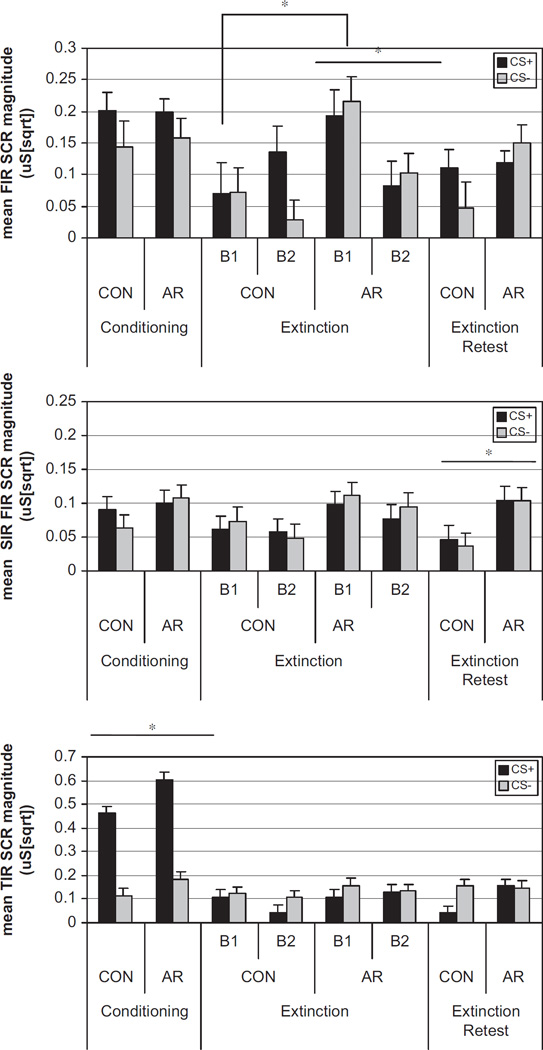
Fig. 2.
Mean SCR magnitudes to the CS+ and CS− for first interval (upper panel), second interval (middle panel), and third interval responses (lower panel) during conditioning (left panel), extinction (centre panel), and extinction-retest (right panel) for at-risk and control children. All analyses showing significant Group main effects are displayed with *.

