
Fig. 2.
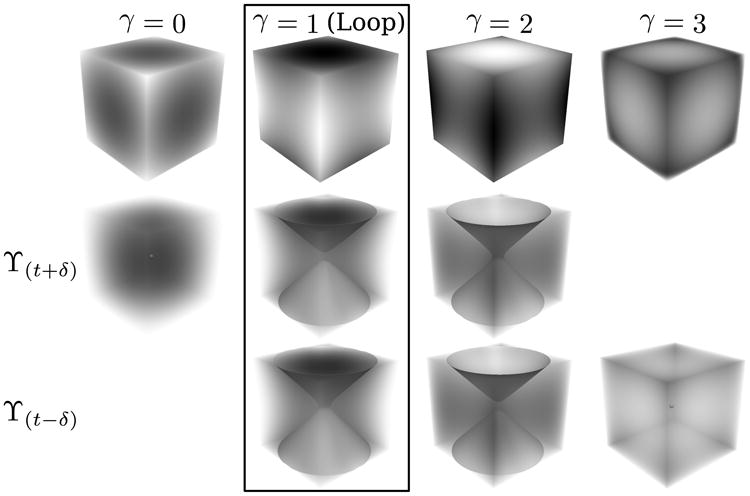
For a Morse function f, all possible critical points, p, are shown on the first row with their indices on top. Upper (ϒ(t+δ)) and lower (ϒ(t–δ)) level sets are shown on the second and third rows (for t = f(p) and δ being a small positive number). The case where a loop forms by tracks in TDI is shown in the box.