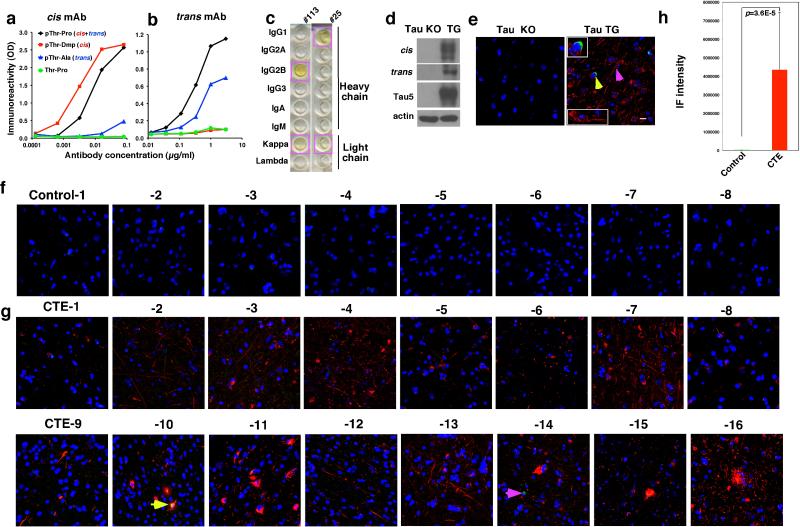
Extended Data Figure 1. Characterization of cis and trans p-tau mAbs and robust cis p-tau in human CTE brains.
a, b, Characterization of the specificity of cis and trans p-tau mAbs by ELISA. cis (a) and trans (b) antibodies at various concentrations were incubated with cis (pT231-Dmp), trans (pT231-Ala), cis+trans (pT231-Pro) or T231-Pro tau peptides, followed by detecting the binding by ELISA. Representative examples of ELISA are shown from 3 independent experiments. pT231-Pro, CKKVAVVRpT(Pro)PKSPSSAK; pT231-Pip, CKKVAVVRpT(homoproline)PKSPSSAK; pT231-Ala, KVAVVRpT(Alanine)PKSPS; pT231-Dmp (KVAVVRpT(5,5-dimethyl-L-proline)PKSPS). c, Determination of the isotypes of cis and trans p-tau mAbs. Isotypes of cis and trans mAb heavy and light chains were determined by ELISA assay using a commercially available assay kit. d, e, Characterization of the specificity of cis and trans p-tau mAbs by IB and IF. Brain lysates (d) or sections (e) prepared from tau-deficient (KO) or wild-type tau-overexpressing (TG) mice were subjected to IB or IF with cis and/or trans antibody. The cis and trans signals were readily detected in TG, but not at all in KO mouse brains, with cis in the soma and neurites (pink arrow), but trans only in the soma (yellow arrow) (insets). Similar results were observed in at least three different animals. cis, red; trans, green; DNA, blue. f-h. Robust cis p-tau in human CTE brains. 16 CTE brain tissues and 8 healthy controls were subjected to IF, with one representative image from each case being shown) (f, g). Yellow arrow points to a neuron expressing both cis (red) and trans (green) p-tau, while pink one to a neuron expressing only trans in the soma. Fluorescence immunostaining intensity of cis p-tau was quantified using Volocity 6.3 from Perkin Elmer (h). The results are expressed as means ± s.d. and p values determined using the Student's t test.

