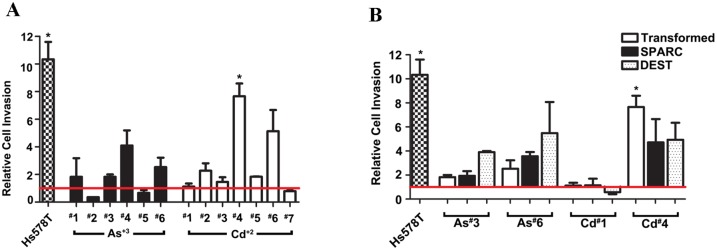
Fig 10. Relative cell invasion of Hs578T, non-transfected UROtsa, SPARC-transfected, and blank vector (DEST) cells lines compared to the parent UROtsa cells.
White graph bars represent the As+3 and Cd+2 transformed cell lines, the black graph bars represents SPARC transfected cell lines, while dotted bars represents blank vector transfected cell lines. Red horizontal line at 1 indicates the level of invasion of the UROtsa parent cells. *Denotes a statistically significant difference from the UROtsa parent cells (p < 0.05).

