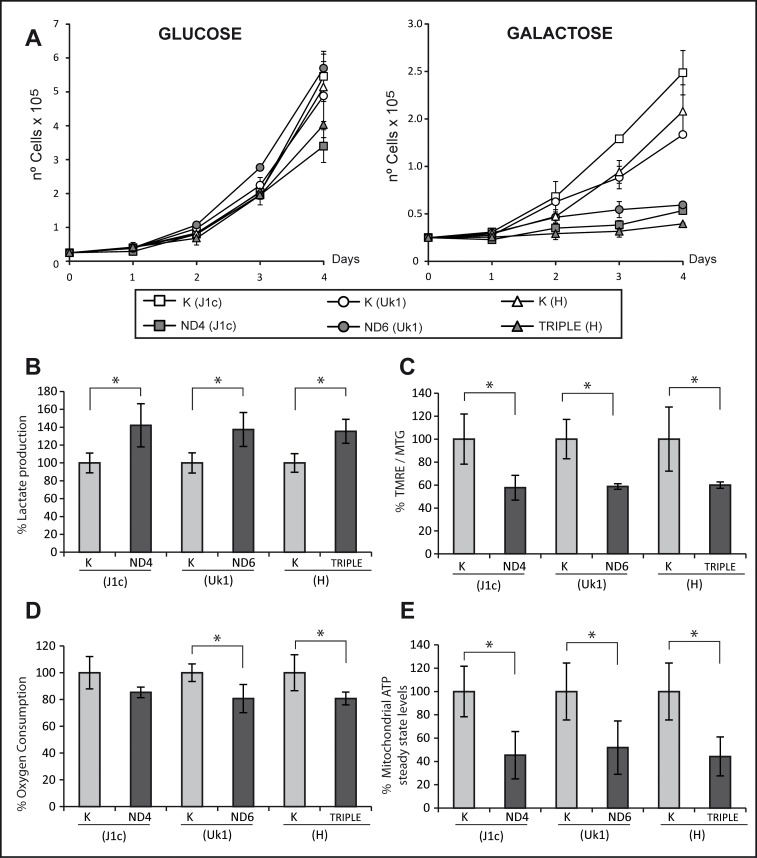
Fig 1. Cybrids carrying the triple mutation show similar biochemical parameters to those with single mutations.
(A) Growth analysis of control and mutant cell lines. Cells were grown in glucose or galactose to evaluate their mitochondrial function. Lines represen the mean of two different clones measured in three independent experiments. Error bars represent standard deviation. (B) Lactate production was measured in culture medium following a 48-h culture period and normalized to total amount of protein. (C) Mitochondrial inner membrane potential was evaluated as the ratio of TMRE and MTG fluorescence by flow cytometry. (D) Oxygen consumption of 4×10⁶ cells was recorded for 30 minutes using a Clark-type O2 electrode. (E) Mitochondrial steady-state ATP was measured in cells incubated with 5 mM 2-deoxy-D-glucose and 1 mM pyruvate for 2.5 h. ATP was normalized to the total amount of protein. Bars in histograms are the mean from two different clones measured in three independent experiments. Data are represented as percentage relative to their haplogroup control. Error bars indicate standard deviation. * p<0.05 determined by one way ANOVA followed by Tukey´s test for multiple comparisons.

