
Fig 3. Dynamic Bayesian Gene Group Activation (DBGGA) Gene Ontology (GO) Term analysis.
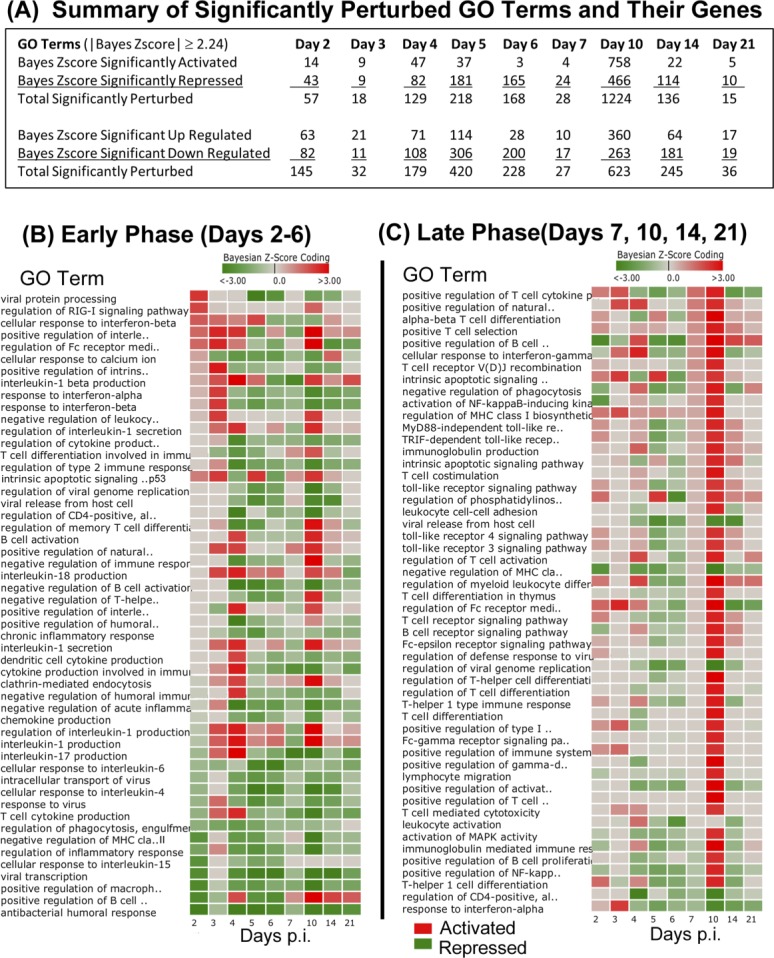
(A) Summary table of significantly perturbed GO terms and genes described by day post inoculation. Only GO terms and their genes with Bayesian score ≥|2.24| are included in analysis. (B-C) Heat maps of perturbed GO terms described by day post inoculation (p.i.) and identified from the Early Phase (B) and the Later Phase (C). Red color indicates activation, green color indicates repression. Intensity of color represents amplitude of perturbation. The list of GO terms shown represents a subset of all perturbed terms that were selected as being most relevant to innate and adaptive immune response.